WASM's Debugging Blind Spots
I remember spending a solid day chasing a bizarre bug in a WebAssembly module. It wasn't a crash, exactly, just…wrong results. The application seemed to be calculating values incorrectly, and the error only manifested under specific conditions. Tracking it down felt like searching for a ghost. This is, unfortunately, a common experience with WebAssembly. It’s a powerful technology, but debugging it can be a real headache.
JavaScript is forgiving. WASM isn't. Because it runs close to the metal, you don't get helpful error strings; you get cryptic runtime crashes. If your source maps fail, you're stuck reading raw WebAssembly Text (WAT), which feels like reading a foreign language without a dictionary.
WASM is moving into serverless and embedded systems. As these apps get more complex, you can't treat debugging as an afterthought. It's the difference between a stable production environment and a week spent chasing ghosts in a stack trace.
Browser tools for WASM
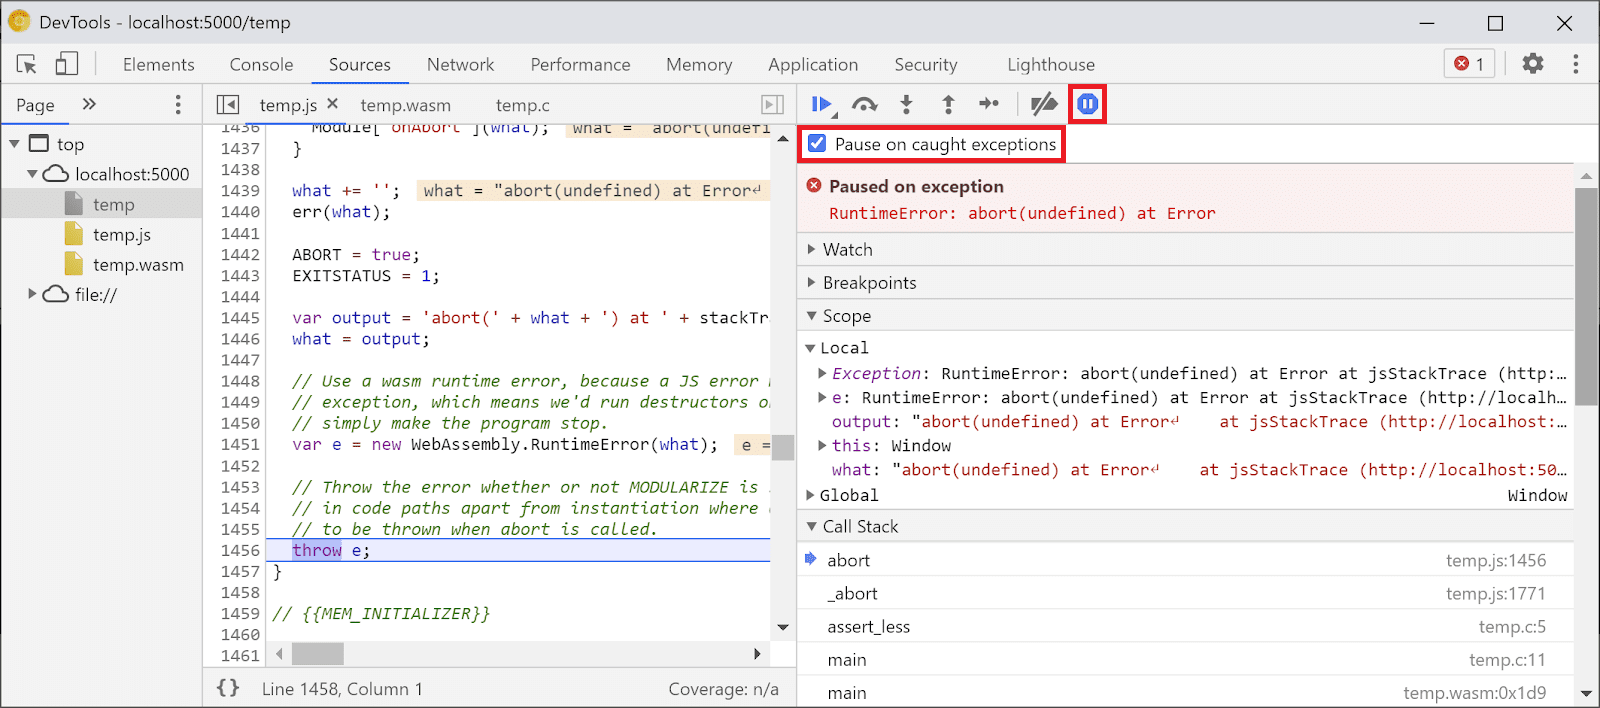
Fortunately, modern browsers provide surprisingly robust debugging tools for WebAssembly. Chrome, Firefox, and Edge all offer features specifically designed to help you inspect and step through WASM code. The first step is simply loading the WASM module in your browser's DevTools. You'll usually find it listed under the 'Sources' or 'Debugger' tab, alongside your JavaScript files.
Once loaded, you can set breakpoints directly in the disassembled WASM code. Stepping through the code line by line allows you to observe the execution flow and examine the values of variables. The call stack is your friend here, helping you understand how you arrived at a particular point in the code. Pay attention to the error messages; they can sometimes provide clues, even if they aren’t always perfectly clear.
However, keep in mind that you’re often debugging disassembled code. This means you're looking at the low-level instructions, not the original source code you wrote. This is where source maps become invaluable. Without them, debugging can feel like navigating a maze. The Chrome DevTools documentation (developer.chrome.com) has excellent resources on debugging WebAssembly, including detailed guides and examples.
The browser DevTools aren’t a perfect solution, but they're a great starting point. They provide a visual interface for inspecting the WASM module’s state and stepping through its execution. Learning to effectively use these tools is the first step towards mastering WASM debugging. Don’t underestimate the power of a well-placed breakpoint and a careful examination of the call stack.
Mapping back to source code
Source maps are files that map the disassembled WASM code back to your original source code. They act as a translation layer, allowing you to debug WASM as if you were debugging JavaScript or any other high-level language. Without source maps, you’re stuck with cryptic instruction addresses; with them, you can step through your C++, Rust, or AssemblyScript code directly.
Generating source maps depends on the toolchain you’re using. For Rust, you might use the `wasm-bindgen` crate with the `--emit-section` flag. AssemblyScript typically generates source maps automatically. C++ requires more configuration, often involving compiler flags and build scripts. The process isn’t always straightforward, and it often requires some experimentation.
To use source maps in your browser’s DevTools, you usually need to configure the DevTools settings to enable source map support. In Chrome, this is typically enabled by default, but it’s worth checking. Once enabled, the DevTools will automatically load and use any available source maps, allowing you to debug with your original source code. Not all toolchains automatically generate source maps, and sometimes it requires extra build configuration.
Common WASM Runtime Errors Explained
WASM runtime errors can be notoriously difficult to decipher. One common error is a memory access violation. This usually happens when your WASM code tries to read or write to memory outside of the allocated bounds. In DevTools, this might show up as an “invalid trap” or a similar error message, often accompanied by a stack trace pointing to the offending instruction.
Another frequent culprit is an invalid trap. Traps are used to signal errors in WASM, and an invalid trap suggests that something unexpected happened during execution. This could be due to a variety of factors, including division by zero, an out-of-bounds array access, or an unhandled exception. The stack trace is crucial for pinpointing the source of the trap.
Unexpected behavior, where the WASM module produces incorrect results without crashing, can be particularly challenging. These errors often stem from subtle bugs in the code, such as incorrect calculations or logic errors. Debugging these issues requires careful examination of the code and the data flow. Pay close attention to the values of variables and the execution path.
A less common, but still problematic, error is a stack overflow. This occurs when the WASM module exceeds the maximum stack size. Stack overflows are often caused by recursive functions or deeply nested function calls. Increasing the stack size might be a temporary workaround, but the underlying issue needs to be addressed. The errors unique to WASM often revolve around its memory model and low-level execution.
- Memory access violations occur when code hits an address outside the linear memory bounds.
- Invalid trap: General error signal, often due to division by zero
- Unexpected behavior: Incorrect results without crashing
- Stack overflow: Excessive recursion or nested calls
Debugging with WASM-Specific Tools
While browser DevTools are a good starting point, several tools are designed specifically for debugging WebAssembly. `wasm-objdump` is a command-line utility that allows you to disassemble WASM modules. This can be helpful for understanding the low-level instructions and identifying potential issues. It’s part of the Binaryen toolchain.
Tools for static analysis, like those offered by some security auditing firms, can help identify potential vulnerabilities and bugs in your WASM code before you run it. These tools analyze the code without executing it, looking for patterns that might indicate problems. They aren’t a replacement for runtime debugging, but they can be a valuable addition to your toolkit.
Kitware (kitware.com) offers resources on debugging WASM pipelines, particularly in the context of scientific computing and visualization. Their tools and techniques can be helpful for debugging complex WASM applications. Remote debugging options are also available in some cases, allowing you to connect a debugger to a running WASM module on a remote server.
WebAssembly Debugging Tool Comparison (2026)
| Tool | Ease of Use | Key Features | Language/Toolchain Support | Cost |
|---|---|---|---|---|
| Browser DevTools (Chrome, Firefox, etc.) | Generally High | Source-level debugging (when source maps are available), stepping, breakpoints, call stack inspection, performance profiling. | Most languages compiling to WASM (C, C++, Rust, AssemblyScript, etc.). Relies on compiler/toolchain support for source maps. | Typically Free (as part of the browser) |
| wasm-objdump | Lower, command-line focused | Disassembly of WASM modules, viewing module structure, inspecting functions and exports. Good for low-level analysis. | WASM modules directly. Independent of source language. | Free and Open Source |
| wasm-bindgen (Rust) | Moderate, requires Rust knowledge | Facilitates interaction between WebAssembly and JavaScript. Debugging benefits are indirect, through JavaScript debugging. | Primarily Rust, used for creating WASM modules from Rust code. | Free and Open Source |
| Binaryen | Moderate to High (with tooling) | Compiler and toolchain infrastructure. Includes tools for optimization and debugging, such as disassembler and validator. | Supports a wide range of languages that compile to WASM, as it operates on the WASM intermediate representation. | Free and Open Source |
| WASI SDK | Moderate | Provides tools for building and debugging WASI-compatible WASM applications. Offers a more standardized environment. | Languages compiling to WASM that target WASI (WebAssembly System Interface). | Free and Open Source |
| Debuggers integrated with IDEs (VS Code, etc.) | High, if configured correctly | Leverages browser DevTools or other backends, providing a GUI and IDE integration for debugging. | Dependent on the specific IDE extension and underlying debugging backend. | Typically Free (IDE may have a cost) |
Qualitative comparison based on the article research brief. Confirm current product details in the official docs before making implementation choices.
The linear memory model
WASM’s memory model is different from JavaScript’s. In WASM, memory is a contiguous block of bytes, and you’re responsible for managing it directly. This can lead to memory-related bugs like buffer overflows, where you write data beyond the allocated bounds of a buffer. These overflows can corrupt memory and lead to crashes or unexpected behavior.
Use-after-free errors occur when you try to access memory that has already been freed. This is a classic memory management bug that can be difficult to track down. DevTools can help you inspect WASM memory, allowing you to examine the contents of memory locations and identify potential corruption. Be aware that WASM’s linear memory model means you're dealing with raw bytes, so interpreting the data can be challenging.
Memory leaks, where memory is allocated but never freed, can also occur in WASM. Over time, these leaks can consume all available memory, leading to performance degradation or crashes. Tools like Valgrind (though not directly for WASM, similar principles apply when inspecting memory usage from the host environment) can help detect memory leaks. Careful memory management is crucial for building robust WASM applications.
Beyond the Browser: Server-Side WASM
Debugging WASM running on the server, such as with Wasmtime or Wasmer, differs from browser-based debugging. You typically don’t have access to the same visual debugging tools. Instead, you might rely on logging, tracing, and command-line debuggers. Wasmtime and Wasmer often provide their own debugging tools and APIs.
Remote debugging is common in server-side environments, allowing you to connect a debugger to a running WASM module on a remote server. This requires configuring the WASM runtime and the debugger to communicate with each other. Server-side WASM debugging is a rapidly evolving area, and new tools and techniques are constantly emerging.


No comments yet. Be the first to share your thoughts!