Why AI debugging matters now
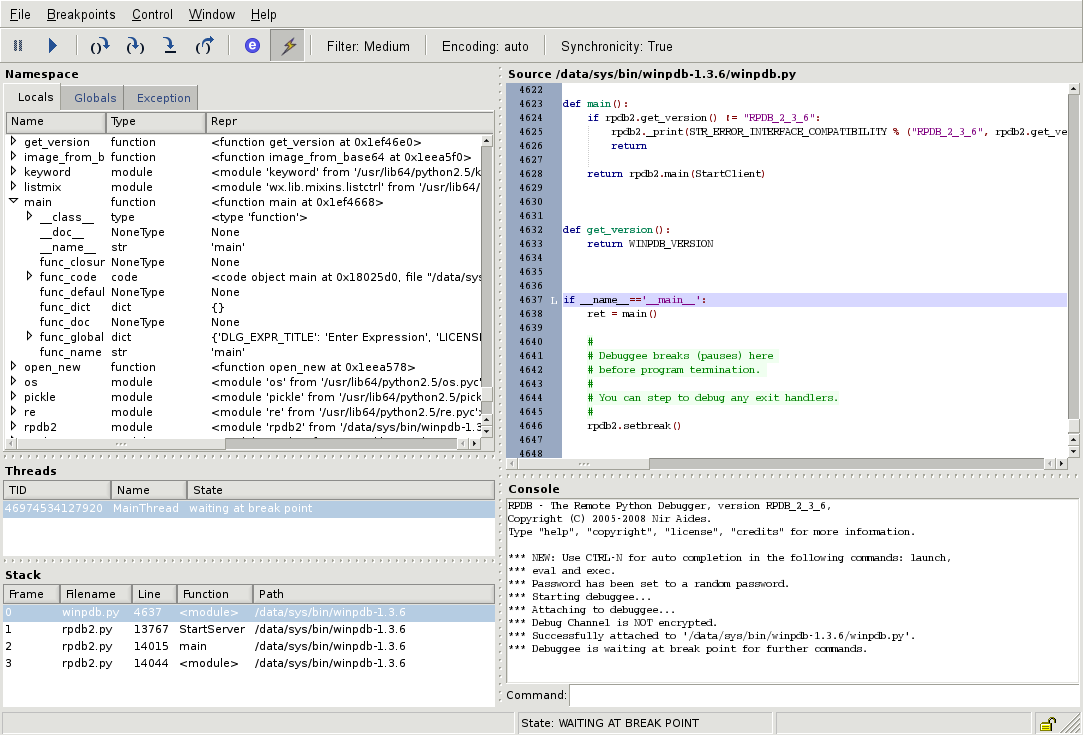
Manual breakpoint debugging is becoming a bottleneck. In 2026, the average developer spends hours stepping through code, hunting for the single line that caused a production outage. AI-assisted root cause analysis changes this dynamic by shifting the focus from "where did it break?" to "why did it break?". Instead of manually tracing variable states, AI tools analyze stack traces, logs, and code context to pinpoint the exact source of an error.
This shift is critical for maintaining velocity. Traditional debugging requires deep familiarity with the codebase and the ability to reproduce complex edge cases. AI tools, integrated directly into IDEs like Visual Studio Code or JetBrains IDEs, automate this cognitive load. They don't just highlight syntax errors; they understand the logic flow and suggest fixes based on millions of open-source repositories and internal team patterns.
The result is a significant reduction in mean time to resolution (MTTR). By automating the initial investigation phase, developers can focus on architectural improvements and feature development rather than firefighting. This is why the top AI debugging tools of 2026 are not just nice-to-have extensions, but essential infrastructure for modern software teams.
5 AI Debugging Tools and IDE Recommendations
By 2026, AI debugging has evolved from simple syntax highlighting to autonomous root-cause analysis within integrated development environments. This selection highlights five specific tools and IDEs that leverage advanced context awareness to resolve complex code errors instantly.
1. Visual Studio Code with GitHub Copilot
Visual Studio Code combined with GitHub Copilot offers a seamless pair-programming experience that accelerates debugging by suggesting context-aware code completions and inline explanations. The integrated terminal and intelligent error detection streamline the identification of syntax issues and logical flaws in real-time.

2. JetBrains IDEs with AI Assistant
JetBrains IDEs feature a built-in AI Assistant that understands complex project structures, allowing developers to generate unit tests and refactor code with precision. This deep integration helps isolate bugs by analyzing semantic relationships across files, making it easier to trace errors in large-scale applications efficiently.

3. Chrome DevTools frontend debugging
Chrome DevTools provides essential frontend debugging capabilities, enhanced by AI-driven insights into performance bottlenecks and network issues. Developers can visualize rendering problems and identify memory leaks directly within the browser environment, ensuring optimal user experience without leaving the development workflow.

4. Visual Studio Enterprise debugger
Visual Studio Enterprise delivers a robust debugger equipped with AI-assisted diagnostics that pinpoint exceptions and stack trace errors with remarkable accuracy. Its intelligent code analysis features help developers understand complex logic flows, reducing the time spent troubleshooting intricate backend issues in enterprise-grade applications.

5. Amazon CodeWhisperer standalone integration
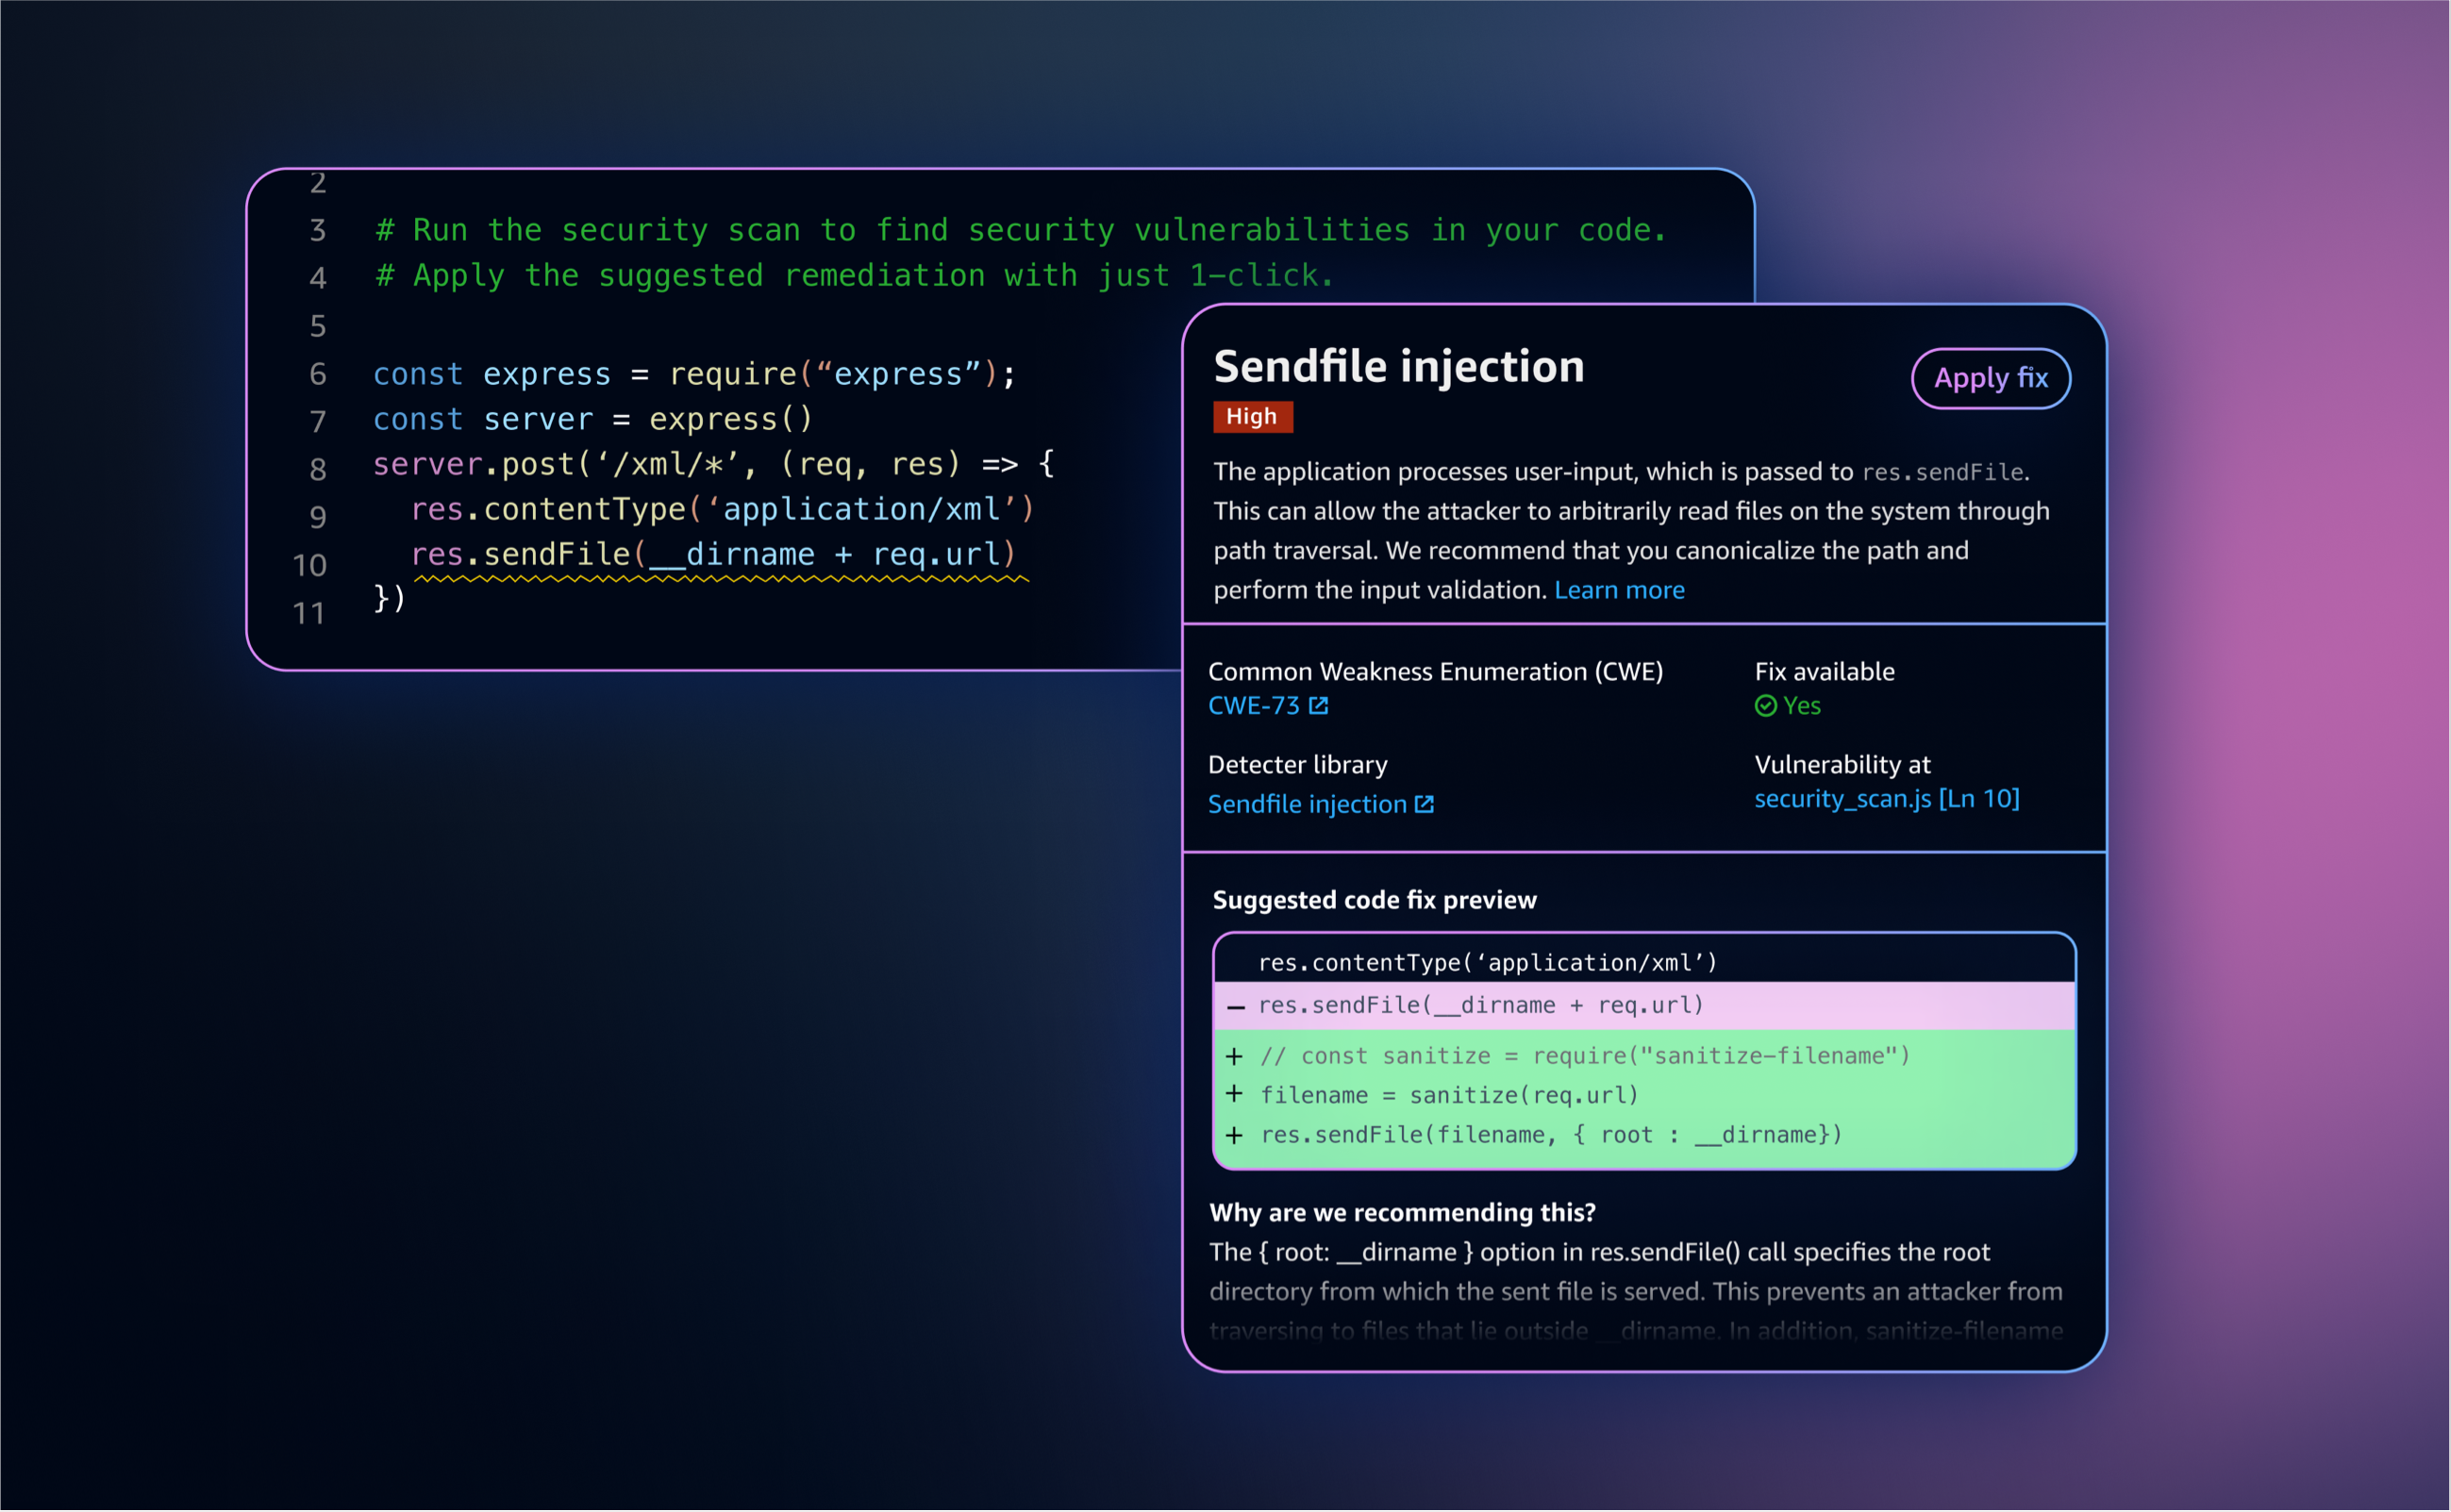
Amazon CodeWhisperer integrates directly into various IDEs, offering security-focused AI recommendations that scan for vulnerabilities while suggesting secure code alternatives. This standalone tool enhances debugging by preventing common security flaws and providing immediate feedback on code quality, ensuring robust and safe application development practices.
Comparing the top 5 debugging tools
Choosing the right debugging environment depends on your primary language and whether you need deep IDE integration or specialized browser analysis. The following comparison breaks down the core capabilities of Visual Studio Code, JetBrains IDEs, Chrome DevTools, Visual Studio, and WinDbg to help you match the tool to your workflow.
| Tool | Price | Primary Languages | AI Capabilities |
|---|---|---|---|
| Visual Studio Code | Free | JavaScript, Python, TypeScript, C++ | Copilot integration, IntelliSense |
| JetBrains IDEs | Paid subscription | Java, Kotlin, Python, Go, PHP | CodeGeeX, AI-assisted refactoring |
| Chrome DevTools | Free | HTML, CSS, JavaScript | Performance profiling, Lighthouse audits |
| Visual Studio | Free to Paid tiers | C#, C++, .NET, Python | GitHub Copilot, IntelliCode |
| WinDbg | Free | C, C++, C#, Assembly | Symbol analysis, crash dump processing |
VS Code and JetBrains offer the most comprehensive AI-assisted debugging experiences for general-purpose languages, leveraging large language models to suggest fixes and explain errors. Chrome DevTools remains the essential standard for frontend developers, providing granular control over network requests and rendering performance. For low-level system debugging, WinDbg and Visual Studio provide the necessary depth for analyzing memory dumps and native code execution.


As an Amazon Associate, we may earn from qualifying purchases.
How to choose the right debugging tool
Selecting a debugging tool requires matching specific language support to your team’s size and workflow. The best 2026 AI debugging features—like predictive error highlighting and automated root-cause analysis—only matter if the tool integrates cleanly into your existing stack.

Native support is non-negotiable. For JavaScript and TypeScript, Visual Studio Code with its integrated debugger is the standard. C and C++ developers typically rely on LLDB or WinDbg for low-level memory inspection. Ensure the tool supports your specific framework versions, not just the language.

Solo developers can work with local CLI tools like GDB, but larger teams need shared contexts. Look for tools that offer cloud-based session sharing or integrated error tracking like Sentry. This allows junior developers to understand complex bugs without needing senior-level expertise in every stack.
Modern AI debugging goes beyond simple breakpoints. The best tools now offer natural language queries to explain stack traces and suggest fixes. Prioritize tools that integrate AI directly into the IDE, reducing the context switching between your editor and documentation.
As an Amazon Associate, we may earn from qualifying purchases.
Frequently asked questions about debugging tools
What are debugging tools? Debugging tools are software programs used to identify, test, and fix issues in other applications. They provide a systematic approach to troubleshooting by offering detailed insights into program execution, memory usage, and variable states. These tools help developers understand how their code runs in real-time, making it easier to isolate bugs and correct errors efficiently.
Is VS Code a debugging tool? Visual Studio Code is an integrated development environment (IDE) with robust built-in debugging capabilities. It supports debugging for JavaScript, TypeScript, and Node.js out of the box. Additionally, the Visual Studio Marketplace offers hundreds of extensions that add debugging support for other languages and runtimes, making it a versatile choice for many developers.
Which is the best HTML debugging tool? Chrome DevTools is widely considered the best tool for debugging HTML and CSS. It allows developers to inspect elements, modify styles in real-time, and analyze network requests. For more complex scenarios, tools like ReSharper or Telerik Fiddler can provide additional layers of analysis for web applications.

No comments yet. Be the first to share your thoughts!