
Pick the right debugger for your stack
Debugging tools are software programs used to identify, test, and debug issues by other programs, providing detailed information about execution and memory. However, there is no single tool that dominates every environment. The most effective debugging tools depend entirely on the language, runtime, and infrastructure you are working with.
For frontend development, Chrome DevTools remains the standard for browser-side diagnosis. It allows developers to inspect network requests, analyze performance bottlenecks, and step through JavaScript code directly in the browser. Similarly, VS Code Debugger offers robust built-in support for JavaScript, TypeScript, and Node.js, with a vast marketplace of extensions that add debugging capabilities for other languages and runtimes.
When working with system-level code or analyzing crash dumps, specialized tools become necessary. GDB (GNU Debugger) is a classic choice for C and C++ developers, offering command-line control over program execution. For Windows-based applications, WinDbg provides deep insights into kernel and user-mode debugging. Meanwhile, LLDB serves as the primary debugger for Swift and Objective-C on Apple platforms.
Choosing the right debugging tools means matching the instrument to the problem. A frontend performance issue requires browser dev tools, while a memory leak in a C++ application demands GDB or Valgrind. Understanding the strengths of each tool ensures you spend less time searching for bugs and more time fixing them.
Visual Studio Code and browser extensions
Visual Studio Code (VS Code) and Chrome DevTools remain the most accessible debugging tools for developers. VS Code offers a unified environment with built-in support for JavaScript, TypeScript, and Node.js, while its marketplace provides extensions for virtually every other language. Chrome DevTools handles the frontend layer, allowing you to inspect the DOM, monitor network requests, and analyze performance directly in the browser.
The VS Code debugger integrates directly into the editor, enabling step-by-step execution, conditional breakpoints, and variable inspection without leaving your workflow. This reduces context switching and keeps your focus on the code. For frontend issues, Chrome DevTools provides a detailed view of how the browser renders your pages, making it easier to identify layout shifts, slow API calls, or memory leaks.
Using these tools together covers the full stack. You can debug backend logic in VS Code and immediately test the frontend changes in Chrome. This combination is a standard for modern web development because it is free, widely supported, and continuously updated by large communities.


As an Amazon Associate, we may earn from qualifying purchases.
System-level and low-level debuggers
When application-level debugging isn't enough, developers need tools that inspect memory, registers, and kernel structures directly. GDB, LLDB, and WinDbg are the standard debugging tools for these deep-dive scenarios, each optimized for specific operating systems and hardware architectures.
GDB (GNU Debugger) remains the industry workhorse for Linux and embedded systems. It supports a wide range of architectures, including ARM and RISC-V, making it indispensable for firmware development and cross-compilation environments. Its scriptability allows for automation in continuous integration pipelines where automated crash analysis is required.
LLDB is the default debugger for the Clang/LLVM toolchain and serves as the backend for Xcode on macOS and iOS. It is designed for high performance and handles large binary files efficiently. For developers working on Apple ecosystems or those who prefer a modern, Python-scriptable interface, LLDB offers a smoother experience than GDB on Unix-like systems.
WinDbg is the primary debugging tool for Windows kernel and driver development. It provides advanced features for analyzing crash dumps (minidumps and memory dumps) and supports live debugging of running Windows systems. Microsoft continues to update WinDbg Preview with new features, keeping it relevant for modern Windows internals work.
| Tool | Primary OS | Key Languages | Best For |
|---|---|---|---|
| GDB | Linux/Unix | C, C++, Rust | Embedded systems, Linux kernel |
| LLDB | macOS/iOS | C, C++, Swift | Apple ecosystem, Xcode dev |
| WinDbg | Windows | C, C++, C# | Windows kernel, driver debug |
Bug tracking and error monitoring platforms
Local debuggers like Chrome DevTools or VS Code are excellent for finding syntax errors and logic bugs in your development environment. However, they are blind to what happens once the code ships to production. That is where remote error tracking and bug management platforms take over. They act as the early warning system for your live application, capturing crashes and performance issues from real users.
Tools like Sentry provide real-time error monitoring by aggregating stack traces and context from your deployed code. Instead of waiting for a user to file a support ticket, Sentry notifies your team the moment an exception occurs, often including the exact code line and user session data. This allows developers to reproduce and fix production bugs before they affect a large segment of your audience.
For broader issue management, platforms like Jira integrate with these monitoring tools to track the lifecycle of a bug. While Sentry tells you what broke, Jira helps your team assign, prioritize, and resolve the ticket. This distinction is critical: local debugging tools help you write better code, while bug tracking platforms help you maintain it at scale.

As an Amazon Associate, we may earn from qualifying purchases.
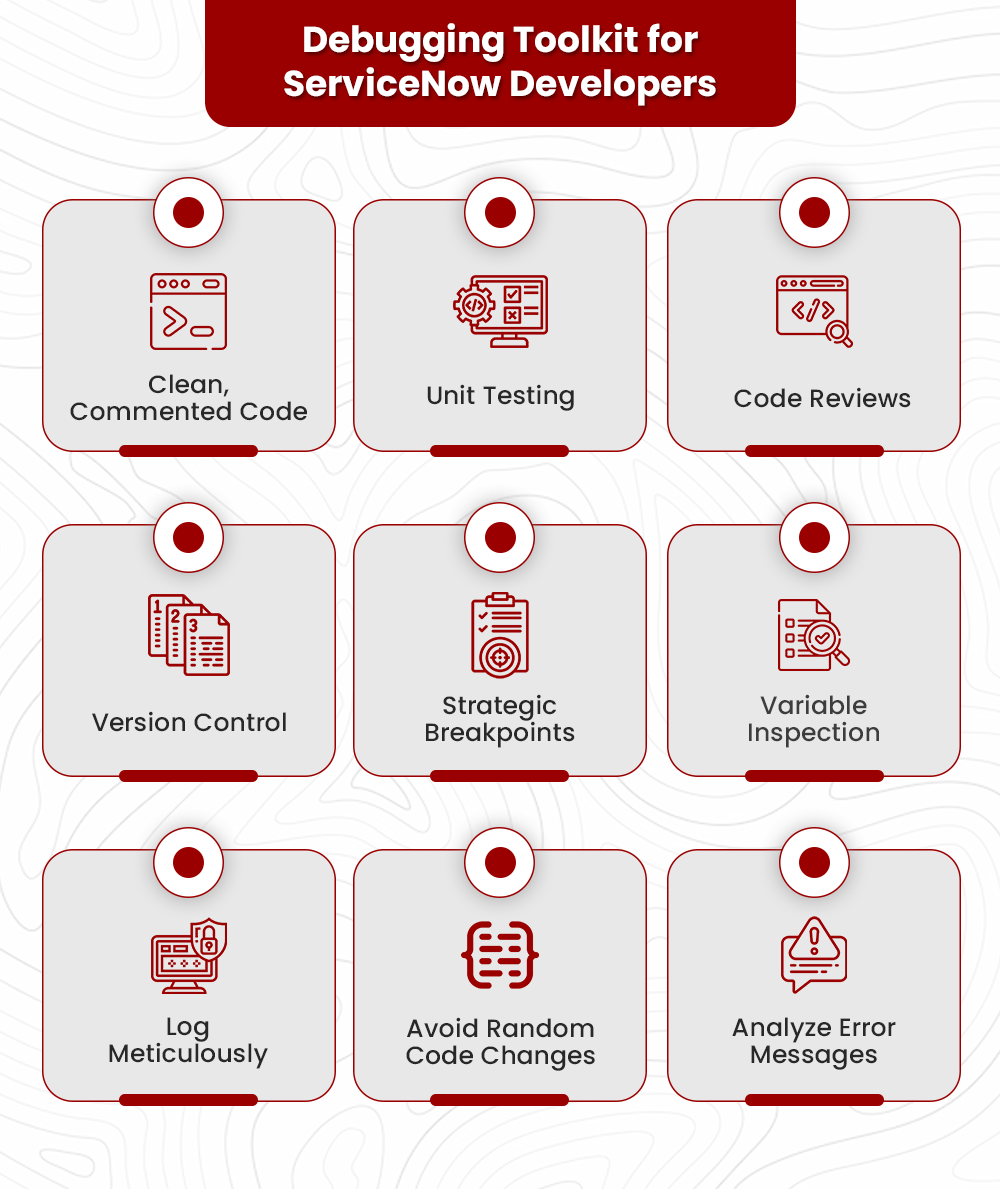
Four core debugging techniques to master
Best Debugging Tools for Developers works best as a clear sequence: define the constraint, compare the realistic options, test the tradeoff, and choose the path with the fewest hidden costs. That order keeps the advice usable instead of decorative. After each step, pause long enough to check whether the recommendation still fits the reader's actual situation. If it depends on perfect timing, unusual access, or a best-case budget, include a simpler fallback.


Common questions about debugging tools
Developers often confuse IDE features with dedicated debugging software. Understanding the distinction helps you choose the right tool for specific bottlenecks.

No comments yet. Be the first to share your thoughts!