Why debugging tools matter now
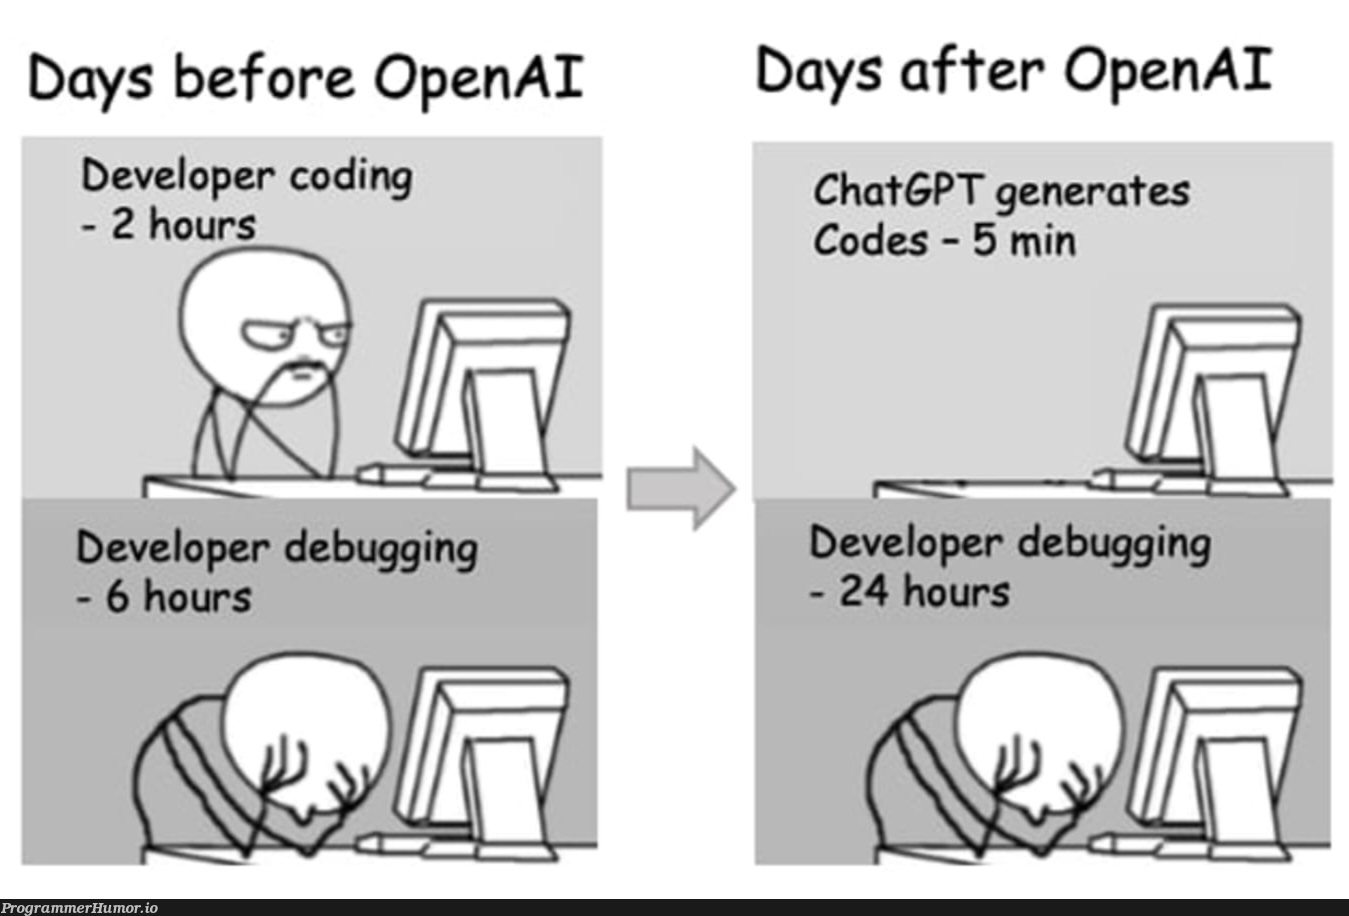
The 2026 debugging revolution is here, and it’s changing how we hunt down bugs. Modern IDEs use AI to predict errors and suggest fixes, turning hours of debugging into minutes.
We’ve all been there: staring at a stack trace that looks like it was written in a language we don’t speak, chasing a null reference through five nested functions, and realizing the bug was in the one file we forgot to save. Debugging is often the most cognitively expensive part of development. It’s not just about finding the error; it’s about holding the entire state of your application in your head while hunting for a single misplaced character.
This is where modern IDEs shift from being passive text editors to active partners. Tools like IntelliJ IDEA, Visual Studio Code, and Xcode have integrated AI-driven assistants that don’t just highlight syntax errors but predict intent. They analyze your codebase in real-time, suggesting fixes before you even hit compile. This reduces the mental load significantly, allowing you to focus on architecture and logic rather than syntax policing.
The difference between a good IDE and a great debugging tool is context awareness. A basic editor tells you that a variable is undefined. An intelligent IDE tells you why it’s undefined, shows you where it was last modified, and offers a quick fix based on similar patterns in your project. For developers, this means less time in the debugger and more time building features that actually matter.
IntelliJ IDEA: The Premier Choice for Java
If you spend your days writing Java, IntelliJ IDEA isn't just an option—it's the standard. JetBrains designed this IDE with a deep understanding of the JVM ecosystem, making it the go-to tool for developers who want their environment to work as hard as they do.
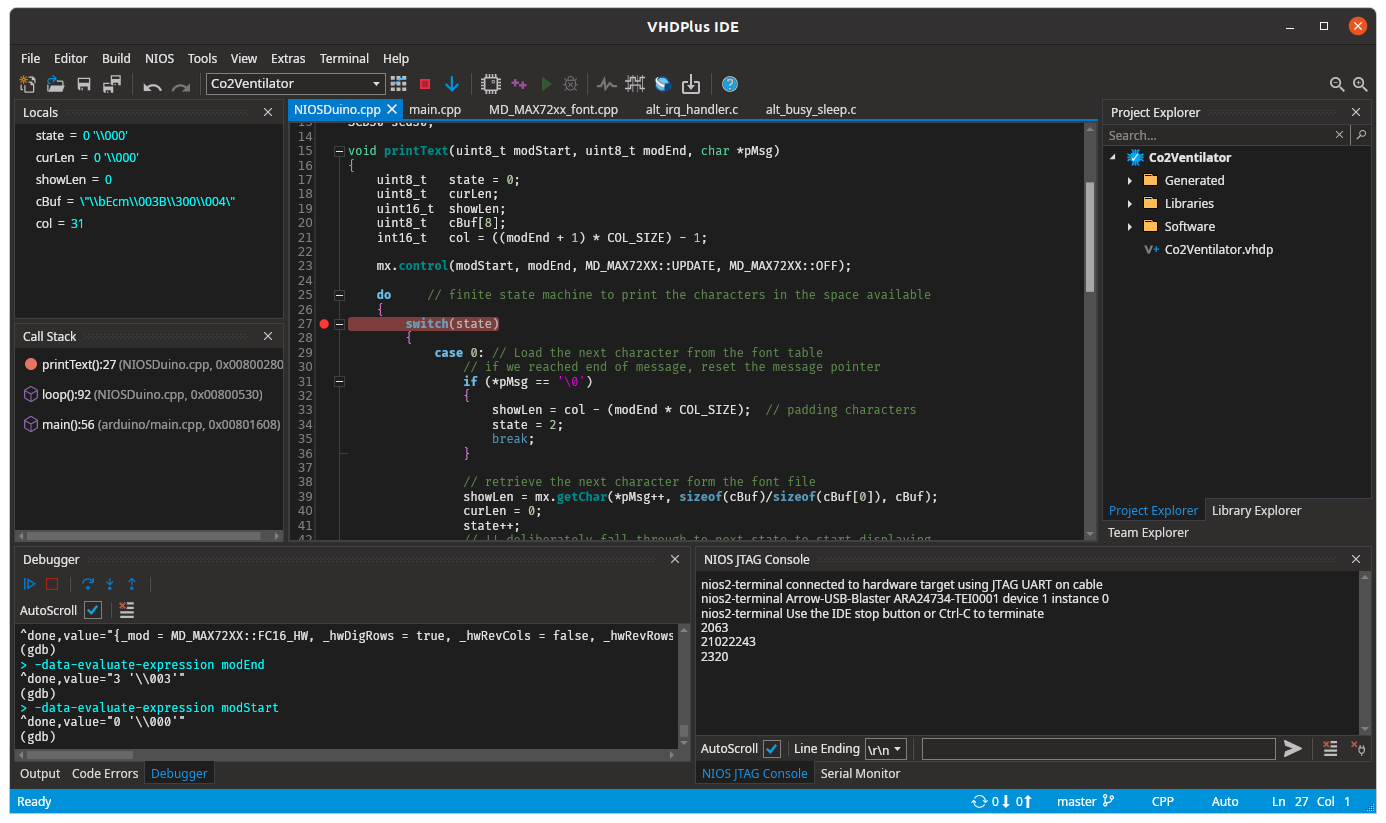
The debugging experience is where IntelliJ truly shines. Instead of manually stepping through code or guessing variable states, the IDE provides intelligent context. It highlights potential issues before you even run the code and offers smart suggestions when you hit a breakpoint. It’s like having a pair of eyes that never blink, catching logic errors and null pointer exceptions that might slip past a manual review.
We also appreciate how it handles refactoring. Renaming a class or extracting a method across a large project usually feels risky, but IntelliJ’s deep code analysis ensures nothing breaks. This reliability saves hours of debugging time that would otherwise be spent fixing broken references.
Whether you choose the Community edition for open-source projects or the Ultimate edition for enterprise frameworks, the core debugging capabilities remain robust. It’s the closest thing to a "set it and forget it" setup for Java development.

As an Amazon Associate, we may earn from qualifying purchases.
Best IDE recommendations for web and Python
When you are juggling JavaScript, TypeScript, and Python, you need an editor that can switch gears without slowing you down. We often see developers torn between the lightweight flexibility of VS Code and the deep, specialized intelligence of PyCharm. Both tools are industry standards, but they solve debugging pain points in very different ways.
VS Code is the Swiss Army knife of development. It starts fast and stays out of your way, letting you install specific extensions for each language you touch. This modularity means you only pay the performance cost for the tools you actually use. PyCharm, on the other hand, is a heavyweight champion built specifically for Python. It comes with sophisticated code analysis and refactoring tools baked in, so you do not have to hunt for plugins to get a professional-grade experience.
The real difference shows up when you are hunting for bugs. VS Code relies on its debugger extension ecosystem, which is powerful but can feel fragmented if you are working across multiple languages. PyCharm’s debugger is deeply integrated into the IDE, offering context-aware variable inspection and intelligent stack traces that feel more like a guided tour than a manual search.
To help you decide which workflow fits your team, we have compared the two side-by-side on the features that matter most for daily debugging.
| Feature | VS Code | PyCharm |
|---|---|---|
| Setup Speed | Instant (lightweight) | Slower (heavyweight) |
| Debugging Depth | Good (via extensions) | Excellent (native) |
| Language Support | Multi-language (modular) | Python-focused (specialized) |
| AI Assistance | GitHub Copilot (plugin) | JetBrains AI (built-in) |
| Cost | Free | Free (Community) / Paid (Pro) |
Xcode: The Non-Negotiable Choice for Apple Development
If you are building for iOS or macOS, Xcode isn't just an option; it is the only way to fully utilize Apple's ecosystem. While we love the flexibility of VS Code for web projects, trying to force it into a native Apple workflow is like trying to drive a sedan off-road. You might get there, but you will struggle with every bump in the road. Xcode provides the integrated debugger and simulator that are essential for catching the subtle, platform-specific bugs that plague Apple development.
The real power lies in the Simulator. It allows you to test your app across different devices and screen sizes without needing a physical lab. You can simulate location services, network conditions, and even battery levels right from your desk. This integration means you can debug memory leaks and UI glitches in real-time, saving hours of guesswork. For any serious Apple developer, skipping Xcode means accepting unnecessary friction in your debugging process.
How to choose the right IDE for your stack
Picking an IDE is less about finding a single "best" tool and more about matching your specific stack to a debugger that actually works. We’ve seen developers waste hours wrestling with broken breakpoints because they forced a general-purpose editor to handle a specialized language. Let’s walk through a quick framework to narrow your options.

Your primary language should dictate your base choice. Dedicated IDEs like IntelliJ IDEA for Java or PyCharm for Python offer syntax-aware debugging that multi-language editors often miss. If you’re deep in the Apple ecosystem, Xcode isn’t just an option; it’s the only way to get seamless iOS debugging. Stick to tools built for your core syntax to avoid friction.
Not every IDE plays nice with every operating system. Visual Studio Code is a champion for cross-platform work, running smoothly on Windows, macOS, and Linux. However, if you’re building native Windows applications, Visual Studio (the full IDE) remains the gold standard. Ensure your chosen tool supports your host machine’s OS without requiring complex workarounds.
Since your goal is faster debugging, look for IDEs with robust breakpoint management, variable inspection, and stack trace visualization. IntelliJ and VS Code excel here with extensive plugin ecosystems. Avoid lightweight editors if you need deep, language-specific debugging capabilities out of the box. The right tool should help you find the bug, not just highlight the line.

Many powerful IDEs offer free community editions that are more than enough for individual developers. IntelliJ IDEA Community, VS Code, and NetBeans are all free and highly capable. Reserve paid subscriptions for enterprise features or specialized plugins you genuinely need. You don’t need to spend money to get a professional-grade debugging experience.
Frequently asked questions about IDEs
Which IDE is best for Java debugging?
IntelliJ IDEA is the clear leader for Java development. Its deep code analysis and intelligent debugger provide context-aware suggestions that significantly reduce the time spent hunting for null pointer exceptions and logic errors.
How do I debug Python code effectively?
PyCharm offers specialized debugging tools for Python, including context-aware variable inspection and intelligent stack traces. For those who prefer a lighter setup, VS Code with the Python extension provides robust debugging capabilities through its extension ecosystem.
Can I debug iOS apps without Xcode?
While it is technically possible to use external tools, Xcode is the mandatory choice for serious iOS development. It provides the integrated debugger and simulator essential for catching platform-specific bugs that other editors cannot easily access.

No comments yet. Be the first to share your thoughts!