The shift to automated debugging
I've spent too many nights staring at print statements and stepping through stack traces. As we move toward complex microservices and massive frontend libraries, the old way of hunting bugs manually is becoming impossible to sustain.
The sheer size of modern codebases means errors are inevitable, and finding them can be incredibly time-consuming. This is where artificial intelligence is stepping in, offering a new paradigm for identifying and resolving issues. We’re moving beyond simply reacting to bugs to proactively preventing them, and even automatically fixing them.
By 2026, the tools we use to find errors have shifted from simple pattern matching to actual logic analysis. These aren't replacing us; they're just handling the grunt work so we can actually build things.
I’ve seen firsthand how frustrating it can be to spend days hunting down a single bug. The tools available now, and those rapidly evolving, represent a genuine shift in how we approach software quality. It’s a transition from a largely manual process to one where AI handles many of the tedious, repetitive tasks, allowing developers to concentrate on what they do best: building great software.
Ten tools worth using in 2026
The market for AI-powered debugging tools is expanding rapidly. Here’s a look at ten of the most promising solutions available in 2026. These tools aren’t ranked in a strict order, as the best choice depends heavily on your specific needs and tech stack. I'm focusing on tools that are actively evolving and pushing the boundaries of what’s possible.
1. DeepCode (now part of Snyk Code): Originally DeepCode, now integrated into Snyk Code, this tool excels at static code analysis. It uses AI to identify security vulnerabilities and quality issues across a wide range of languages, including JavaScript, Python, and Java. The value isn't just finding bugs, but understanding their severity and providing actionable remediation advice. You can find more at
2. GitHub Copilot: While often touted as a code completion tool, Copilot’s AI can also proactively identify potential errors as you type. It learns from billions of lines of public code to suggest corrections and prevent common mistakes. It's particularly strong within the Microsoft ecosystem, but supports numerous languages. Check it out at
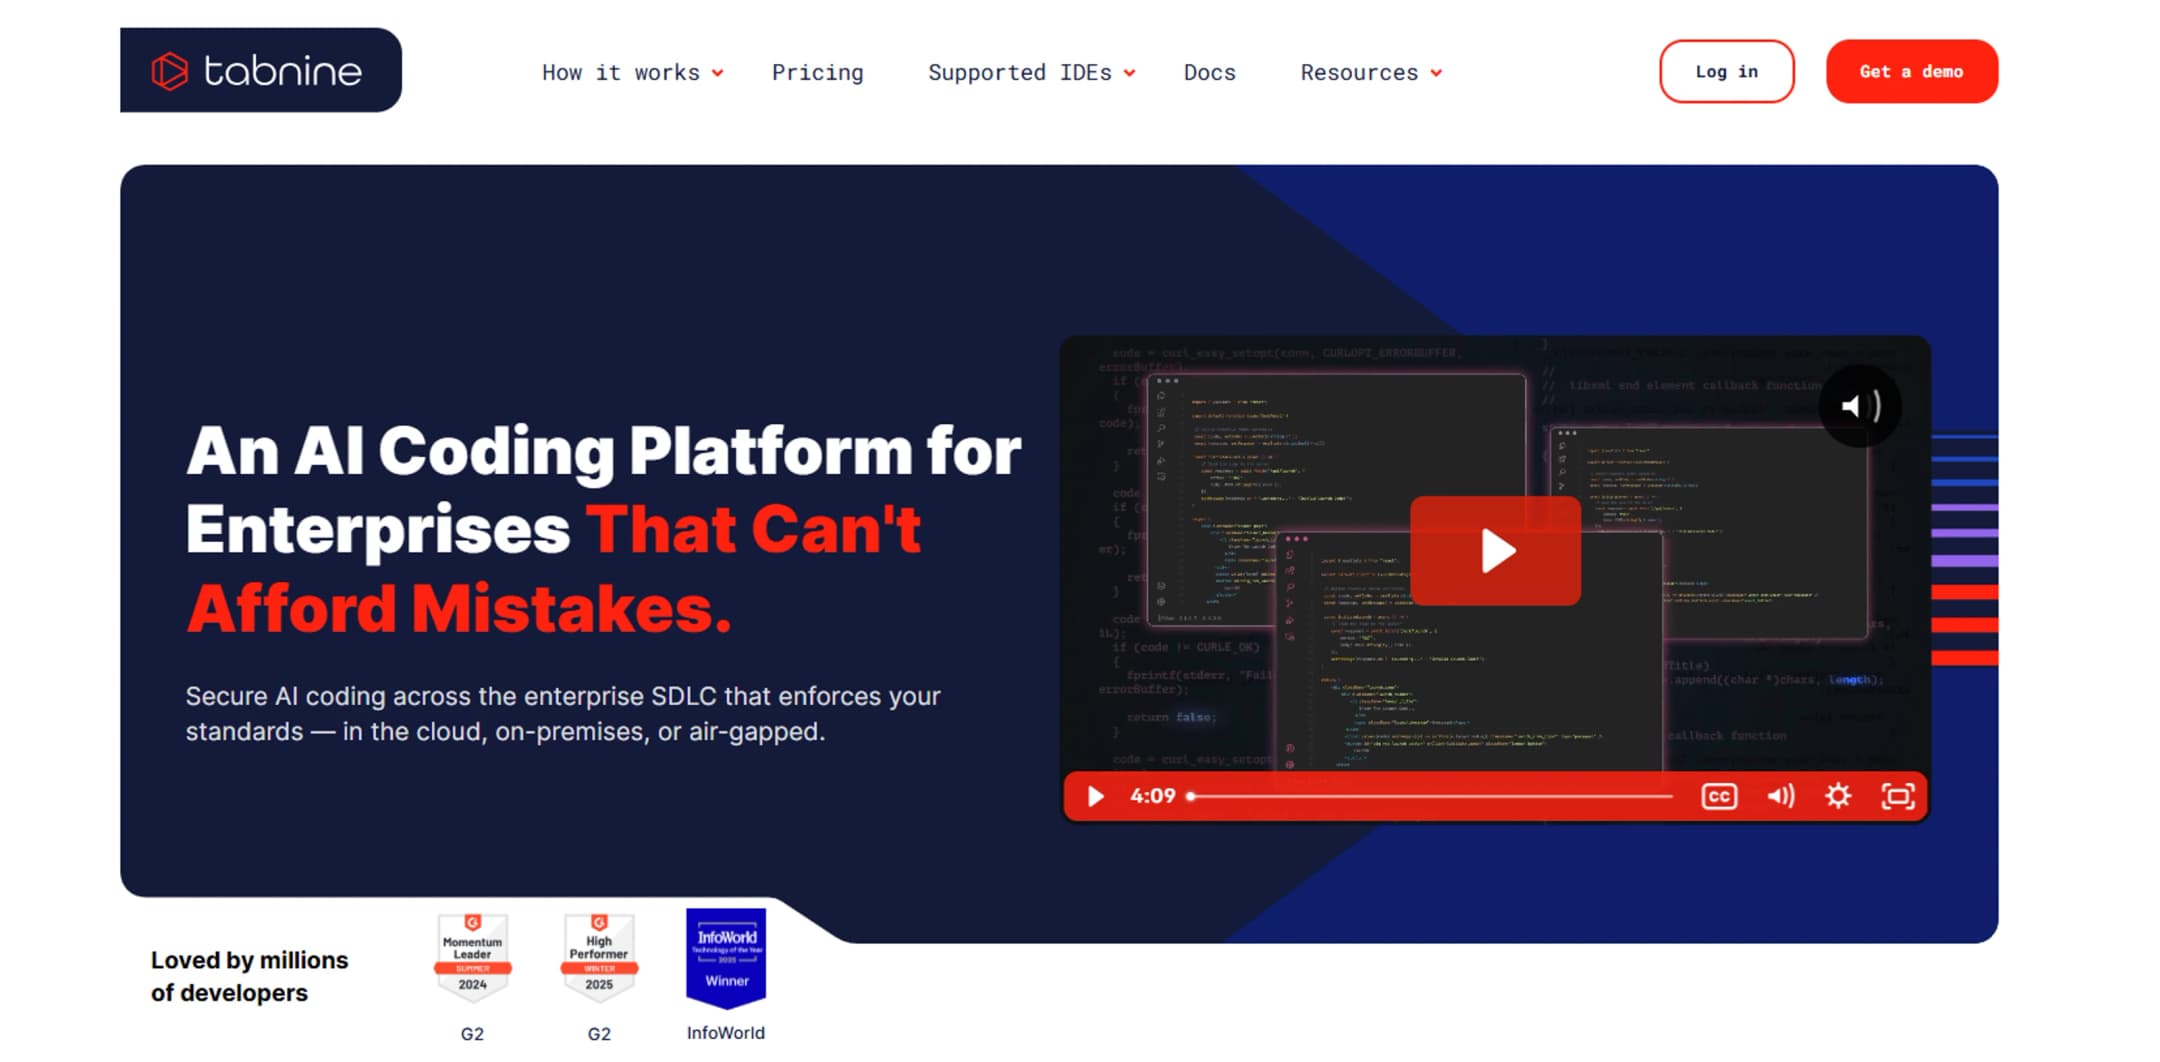
3. Tabnine: Similar to Copilot, Tabnine offers AI-powered code completion and error detection. However, Tabnine emphasizes privacy, allowing developers to train the model on their own codebase without sharing data publicly. This is a significant advantage for organizations with strict security requirements. Details are available at
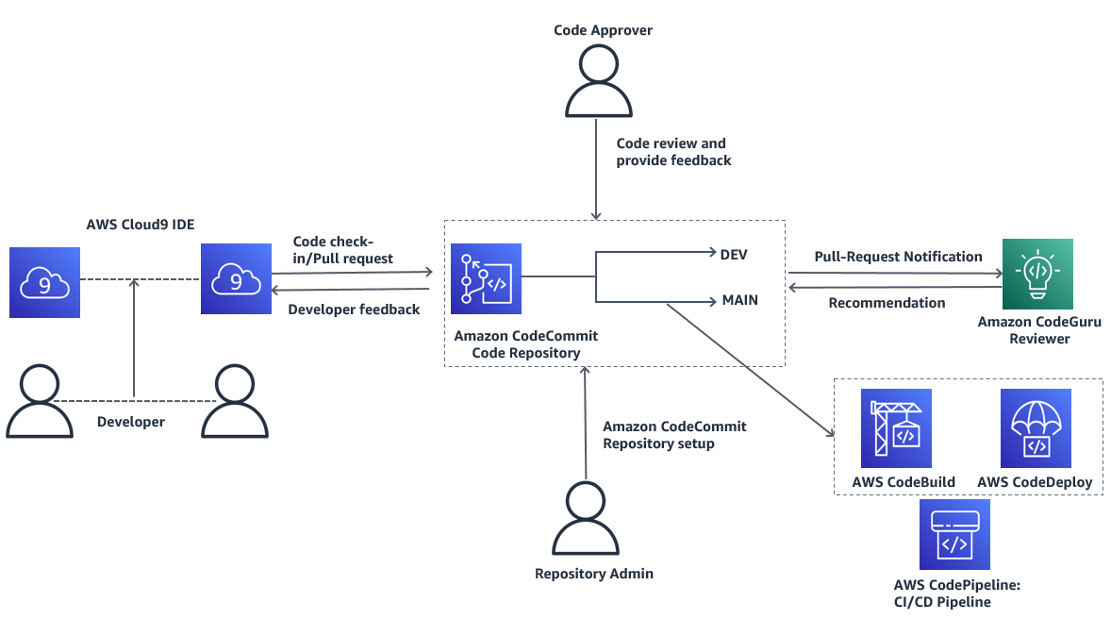
4. Amazon CodeGuru Reviewer: This service focuses on identifying critical issues and hard-to-find bugs in Java and Python code. It uses machine learning to detect code smells, performance bottlenecks, and security vulnerabilities, providing developers with specific recommendations for improvement. See more at
5. Microsoft IntelliCode: Integrated directly into Visual Studio and Visual Studio Code, IntelliCode provides context-aware code completion and error analysis. It learns from your coding patterns to suggest relevant code snippets and identify potential issues. It’s a seamless experience for developers already using Microsoft tools. Learn more at
6. SonarQube with AI features: SonarQube is a long-standing leader in static code analysis. Recent updates have incorporated AI to improve the accuracy of bug detection and prioritize issues based on their impact. It supports a vast number of languages and integrates with popular CI/CD pipelines. Explore it at
7. Codacy: Codacy automates code reviews and provides insights into code quality, security, and style. Its AI-powered engine identifies potential bugs, code smells, and security vulnerabilities, helping developers maintain a high standard of code quality. You can find more information at
8. DeepSource: DeepSource is another strong contender in the static analysis space. It automatically analyzes your code for bugs, performance issues, and security vulnerabilities, providing clear and concise feedback. It also integrates with popular CI/CD tools. More details are at
9. Sentry Performance Monitoring: While primarily a performance monitoring tool, Sentry’s AI capabilities are increasingly focused on identifying the root cause of performance issues and errors. It can correlate performance data with code changes to pinpoint the exact source of problems. Find more at
10. JetBrains AI Assistant: Integrated into the JetBrains IDEs (IntelliJ IDEA, PyCharm, etc.), the AI Assistant offers code completion, code generation, and debugging assistance. It leverages large language models to understand code context and provide intelligent suggestions. You can learn more at
Top 10 AI-Powered Debugging Tools in 2026: A Comparative Overview
| Tool Name | Primary Focus | Supported Languages | Integration with IDEs | Ease of Use |
|---|---|---|---|---|
| DeepCode (now part of Snyk Code) | Static Analysis | Java, JavaScript, Python, C#, Go | VS Code, IntelliJ, GitHub | Intermediate |
| GitHub Copilot | Code Completion & Bug Prediction | Wide range, including Python, JavaScript, TypeScript, Ruby, Go, C++ | VS Code, Visual Studio, Neovim, JetBrains IDEs | Intermediate |
| Tabnine | Code Completion & Bug Detection | Python, JavaScript, Java, C++, C#, Go, PHP, Ruby, TypeScript | VS Code, IntelliJ, Eclipse, Sublime Text, Vim | Beginner |
| Amazon CodeGuru Reviewer | Static Analysis & Code Reviews | Java, Python, JavaScript, TypeScript | AWS Cloud9, VS Code, IntelliJ (via plugin) | Intermediate |
| Microsoft IntelliCode | Code Completion & Intelligent Suggestions | C#, C++, JavaScript, TypeScript, Java | Visual Studio, VS Code | Beginner |
| SonarQube with AI features | Static Analysis & Code Quality | 70+ languages including Java, Python, JavaScript, C# | VS Code, IntelliJ, Eclipse, and many others via plugins | Intermediate to Expert |
| Codacy | Static Analysis & Code Quality | JavaScript, Python, Ruby, PHP, Java, TypeScript, Go | GitHub, GitLab, Bitbucket, VS Code | Intermediate |
| DeepSource | Static Analysis & Automated Code Reviews | Python, JavaScript, Go, Ruby, Java, TypeScript, PHP, C++ | GitHub, GitLab, Bitbucket | Intermediate |
| Sentry Performance Monitoring | Runtime Error Tracking & Performance Issues | JavaScript, Python, Ruby, Java, PHP, Node.js | Integrates via SDKs; supports many frameworks | Intermediate |
| JetBrains AI Assistant | Code Completion, Generation, and Debugging | Kotlin, Java, Python, JavaScript, TypeScript, and others supported by JetBrains IDEs | JetBrains IDEs (IntelliJ, PyCharm, etc.) | Intermediate |
Illustrative comparison based on the article research brief. Verify current pricing, limits, and product details in the official docs before relying on it.
Static vs. dynamic analysis
Traditionally, debugging tools fall into two main categories: static analysis and dynamic analysis. Static analysis examines code without executing it, looking for potential problems like syntax errors, code smells, and security vulnerabilities. It’s like reading a blueprint for a building – you can spot potential structural issues before construction even begins.
Dynamic analysis, on the other hand, involves running the code and observing its behavior. This is where you catch runtime errors, performance bottlenecks, and unexpected interactions. It's like inspecting the building after it's been built, identifying issues that only become apparent when it's in use.
AI is significantly enhancing both approaches. For static analysis, AI algorithms can now identify more subtle and complex bugs than traditional rule-based systems. They can learn from vast amounts of code to recognize patterns that indicate potential problems, even if those patterns don’t violate any specific coding rules. This reduces false positives and focuses developers on the most critical issues.
In dynamic analysis, AI is enabling more intelligent error detection and root cause analysis. Tools can now monitor code execution, identify anomalies, and pinpoint the exact line of code that caused an error – often suggesting a fix. This moves beyond simply reporting an error to actively helping developers understand why it happened.
- Static Analysis: Analyzes code without execution.
- Dynamic Analysis: Analyzes code during execution.
AI-Powered Code Completion & Error Prevention
AI-powered code completion tools have evolved dramatically. They’re no longer just about suggesting the next line of code; they’re about understanding your intent and proactively preventing errors. Tools like GitHub Copilot and Tabnine use machine learning to analyze the surrounding code context and predict what you’re trying to achieve.
This goes beyond simple syntax completion. These tools can identify potential type errors, suggest more efficient algorithms, and even warn you about potential security vulnerabilities as you type. It's a form of real-time code review that helps developers catch issues before they even make it into the codebase.
The key is the massive datasets these models are trained on. By learning from billions of lines of code, they can identify common patterns and suggest solutions that a human developer might not immediately consider. This can significantly reduce the number of bugs that make it into production.
AI-Powered Error Detection in Action
Modern AI debugging tools can instantly identify and suggest fixes for common programming errors. Here's a practical example showing how these tools detect syntax errors and typos that might otherwise slip through manual code review:
// Original buggy code
function calculateTotal(items) {
    let total = 0;
    for (let i = 0; i < items.length; i++) {
        total += items[i].price
        // Missing semicolon detected by AI
    }
    return totla; // Typo in variable name
}

// AI-suggested corrections
function calculateTotal(items) {
    let total = 0;
    for (let i = 0; i < items.length; i++) {
        total += items[i].price; // Semicolon added
    }
    return total; // Variable name corrected
}
In this example, an AI-powered tool would immediately flag two issues: the missing semicolon after the price assignment and the misspelled variable name in the return statement. Tools like GitHub Copilot and Tabnine can provide real-time suggestions as you type, while static analysis tools like Snyk Code and SonarQube can catch these errors during code review. This automated detection saves developers significant debugging time and helps maintain code quality across large projects.
Debugging in the Cloud: A Growing Trend
Cloud-based debugging tools are gaining traction, driven by the rise of cloud-native applications and the need for greater collaboration. These tools allow developers to remotely debug applications running in the cloud, without the need for complex local setups.
The benefits are clear: scalability, accessibility, and collaboration. Cloud debugging tools can easily handle large and complex applications, and they can be accessed from anywhere with an internet connection. Multiple developers can simultaneously debug the same application, making it easier to identify and resolve issues.
Furthermore, cloud platforms often provide access to powerful debugging resources, such as advanced profiling tools and performance monitoring capabilities. This can significantly speed up the debugging process and help developers identify and resolve performance bottlenecks.
AI and Test Automation: A Powerful Combination
The integration of AI with test automation frameworks is transforming the way we ensure software quality. AI can be used to automatically generate test cases, identify edge cases, and analyze test results. This reduces the manual effort required for testing and improves the overall effectiveness of the process.
For example, AI algorithms can analyze code coverage data to identify areas of the application that are not adequately tested. They can then automatically generate test cases to cover those gaps. This ensures that all critical parts of the application are thoroughly tested.
Perhaps even more exciting is the potential for AI to automatically fix failing tests. By analyzing the test results and the corresponding code, AI can identify the root cause of the failure and suggest a fix. This can significantly reduce the time it takes to resolve test failures and improve the overall speed of the development cycle. While fully automated test fixing is still an emerging area, the progress is promising.
Tools like Testim and Applitools are already incorporating AI to improve test stability and reduce maintenance overhead. The ability to create self-healing tests – tests that automatically adapt to changes in the application UI – is a game-changer.
Gear Up for Smarter Debugging: Essential Tools for AI-Powered Bug Hunting

Practical guidance on integrating GitHub Copilot into your workflow · Strategies for leveraging AI to accelerate the software development lifecycle · Tips for effective code generation and review with AI assistance
This handbook offers practical insights into using AI tools like GitHub Copilot to boost developer productivity and streamline the coding process, complementing automated debugging solutions.
Automated code reviews to identify performance bottlenecks and security vulnerabilities · Machine learning-driven insights for code quality improvements · Integration with AWS services for seamless analysis
CodeGuru Reviewer provides automated code analysis, helping developers proactively identify and fix issues before they become bugs, thus enhancing the effectiveness of debugging efforts.
AI-powered code completion for multiple programming languages · Context-aware suggestions to speed up coding · Team-based learning and customization for consistent code quality
Tabnine Pro enhances developer productivity through intelligent code completion, allowing them to write code faster and with fewer errors, which indirectly supports debugging by reducing the introduction of new issues.
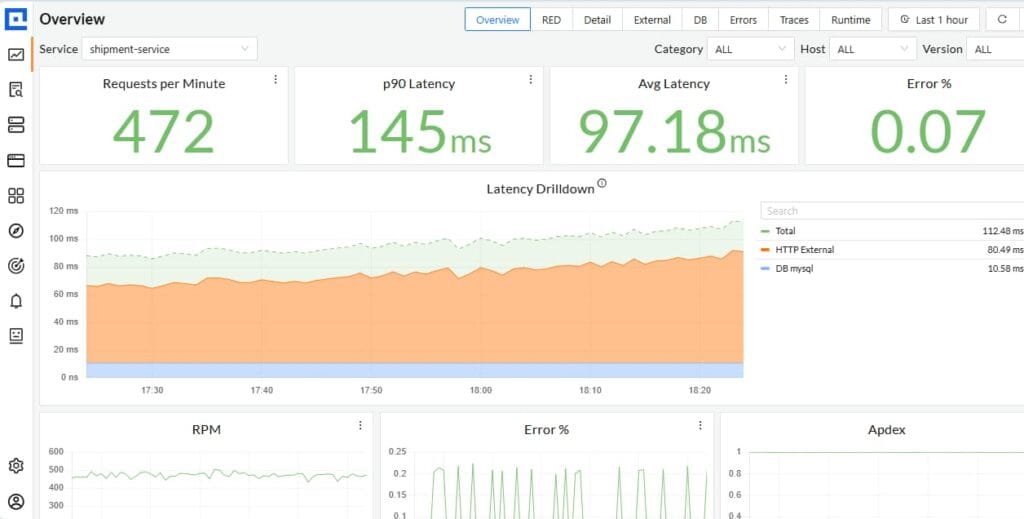
Real-time error tracking and performance monitoring · Detailed insights into application performance and user experience · Tools for diagnosing and resolving issues across the stack
Sentry provides crucial runtime insights into application performance and errors, enabling developers to quickly pinpoint and resolve issues that might be missed by static analysis or automated debugging tools.
AI-powered code generation, explanation, and refactoring within JetBrains IDEs · Contextual code suggestions and documentation generation · Intelligent commit message generation and code review assistance
JetBrains AI Assistant integrates AI directly into the development environment, offering intelligent assistance that can help developers write cleaner code and understand complex logic, thereby reducing the likelihood of bugs and aiding in debugging.
As an Amazon Associate I earn from qualifying purchases. Prices may vary.
Looking Ahead: The Future of AI Debugging
The future of AI debugging is bright. We can expect to see even more sophisticated tools that can proactively prevent bugs, automatically fix errors, and provide developers with deeper insights into their code.
Self-healing code – code that can automatically detect and correct errors – is a long-term goal, but we’re already seeing early steps in that direction. AI-powered root cause analysis will become more accurate and efficient, allowing developers to quickly identify and resolve complex issues. And proactive bug prevention will become the norm, with AI algorithms identifying potential problems before they even manifest as errors.
I believe AI will become an indispensable part of the development workflow, seamlessly integrated into every stage of the software development lifecycle. It won’t replace developers, but it will empower them to build higher-quality software, faster and more efficiently. The focus will shift from finding bugs to preventing them, ultimately leading to a more reliable and user-friendly software experience.

No comments yet. Be the first to share your thoughts!