The shift toward automated debugging
For decades, debugging has been a fundamentally manual process. Developers have relied on techniques like meticulous code inspection, strategically placed print statements, and the incremental stepping through of code with traditional debuggers. These methods, while effective, are often time-consuming, error-prone, and struggle to scale with the increasing complexity of modern software systems. The sheer volume of code in a typical application, combined with intricate dependencies, makes finding and fixing bugs a significant challenge.
We are moving away from manual hunting. AI tools now handle the repetitive scanning that humans miss, catching errors before they hit production. These tools don't replace us; they just do the grunt work of identifying patterns and anomalies in massive codebases.
The AI techniques driving this revolution are diverse. Machine learning algorithms are used to identify patterns indicative of bugs, while natural language processing helps to understand code intent and detect anomalies. Static analysis, enhanced by AI, can pinpoint potential vulnerabilities without executing the code. Dynamic analysis leverages AI to monitor runtime behavior and identify performance bottlenecks. These technologies, when combined, represent a powerful new approach to software quality.
By 2026, the integration of AI into debugging workflows will no longer be a luxury, but a necessity. The demand for faster release cycles, coupled with the growing complexity of software, will make automated bug detection and resolution essential for maintaining a competitive edge. The tools detailed below represent the current vanguard of this transformative trend.
Top 10 AI debugging tools for 2026
The market is moving fast. These ten tools are the ones I've found most effective for 2026, based on how well they actually catch bugs in production and how easily they fit into a standard workflow.
1. DeepCode (now Snyk Code): Snyk Code leverages static analysis with machine learning to identify vulnerabilities and code quality issues. It supports languages like Java, Python, JavaScript, and TypeScript, and integrates seamlessly with popular IDEs. Its strength lies in proactive vulnerability detection, helping developers address security concerns early in the development cycle.
2. GitHub Copilot: Developed by GitHub and OpenAI, Copilot is an AI pair programmer that provides real-time code suggestions and helps identify potential bugs as you type. While not strictly a debugger, its predictive capabilities significantly reduce the likelihood of introducing errors. It excels in Python, JavaScript, TypeScript, Ruby, Go, and C#.
3. Tabnine: Similar to Copilot, Tabnine offers AI-powered code completion with a focus on error prevention. It learns from your coding style and suggests code snippets that are less likely to contain bugs. Tabnine supports a wide range of languages and IDEs, offering both cloud and on-premise deployment options.
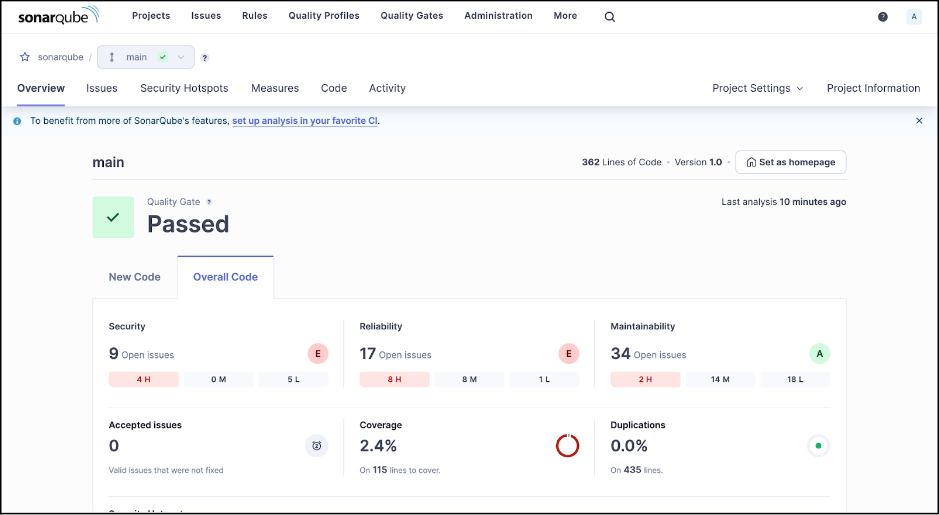
4. SonarQube: A widely adopted static code analysis platform, SonarQube has integrated AI-enhanced quality gates to automatically flag code that doesn’t meet predefined standards. It supports over 30 languages and integrates with CI/CD pipelines for continuous code quality monitoring. Its comprehensive rule set and reporting capabilities are particularly valuable for large projects.
5. CodeGuru (Amazon): Amazon CodeGuru offers ML-powered code reviews and performance recommendations. CodeGuru Reviewer identifies critical issues like resource leaks and concurrency problems, while CodeGuru Profiler helps pinpoint performance bottlenecks. It’s tightly integrated with AWS services and supports Java and Python.
6. Codacy: Codacy provides automated code review with AI-driven quality insights. It analyzes code for bugs, code style violations, security vulnerabilities, and code duplication. Codacy supports a broad range of languages and integrates with GitHub, Bitbucket, and GitLab.
7. Veracode: Veracode focuses on application security testing and debugging. Its AI-enhanced capabilities help identify vulnerabilities in web applications, APIs, and mobile apps. Veracode offers both static and dynamic analysis, providing a comprehensive security assessment.
8. Chrome DevTools: Although a long-standing tool, Chrome DevTools has incorporated AI-driven features for performance profiling and debugging JavaScript code. Its ability to analyze runtime behavior and identify performance bottlenecks makes it a valuable asset for web developers. It's naturally focused on web technologies (HTML, CSS, JavaScript).
9. Airbrake: Airbrake specializes in error monitoring and crash reporting. It uses AI to group similar errors, prioritize issues, and provide detailed diagnostic information. Airbrake supports multiple languages and frameworks, including Ruby, Python, Node.js, and PHP.
10. Memfault: Memfault is designed for debugging production systems, particularly those involving embedded devices and complex software stacks. It uses AI to identify memory leaks, crashes, and performance issues in real-time, providing valuable insights into system behavior.
AI-Powered Debugging Tools: A Comparative Analysis (2026)
| Tool | Languages Supported | Primary AI Feature | Ease of Use (1-5, 5=Easiest) | Integration with IDEs |
|---|---|---|---|---|
| DeepCode (now Snyk Code) | Wide (JavaScript, Python, Java, C#, etc.) | Vulnerability Detection & Static Analysis | 3 | Good, via extensions and APIs |
| GitHub Copilot | Extensive (supports many languages via VS Code) | AI Pair Programming & Real-time Suggestions | 4 | Excellent, native to VS Code and available for other IDEs |
| Tabnine | Broad (JavaScript, Python, Java, C++, etc.) | AI Code Completion & Error Prevention | 4 | Strong, with plugins for major IDEs |
| SonarQube | Wide (over 30 languages) | Static Analysis & AI-Enhanced Quality Gates | 2 | Good, via plugins and integrations, requires setup |
| CodeGuru (Amazon) | Java, Python, JavaScript, TypeScript | Code Reviews & Performance Recommendations | 3 | Strong within AWS ecosystem, limited outside |
| Codacy | Wide (JavaScript, Python, Java, Ruby, etc.) | Automated Code Review & Quality Insights | 3 | Good, integrates with popular Git providers and IDEs |
| Veracode | Multiple (Java, .NET, PHP, JavaScript, etc.) | Application Security Testing & Debugging | 2 | Integrates with CI/CD pipelines and some IDEs |
| DeepSource | Python, JavaScript, Go, Ruby, Java | Automated Code Review & ML-based Issue Detection | 3 | Good, via Git integrations |
Qualitative comparison based on the article research brief. Confirm current product details in the official docs before making implementation choices.
Essential AI Debugging Tools to Elevate Your Code Quality

Comprehensive coverage of static code analysis principles · Practical guidance for implementing analysis tools · Strategies for identifying and resolving code defects early
This book provides foundational knowledge in static code analysis, a critical component for any AI-powered bug detection strategy.

Leverages AI for code completion and generation · Enhances developer productivity through intelligent suggestions · Integrates seamlessly with popular IDEs
GitHub Copilot exemplifies AI's role in accelerating development cycles by assisting with code writing, reducing the time spent on repetitive tasks.

Focuses on AI-driven code completion · Aims to improve coding speed and accuracy · Designed for beginners in AI coding assistants
Tabnine AI represents a practical application of AI in assisting developers with real-time code suggestions, directly impacting debugging efficiency.

Explores prompt engineering for AI coding assistants · Guides users on effectively communicating with AI for code generation · Focuses on mastering AI-assisted coding workflows
Understanding how to effectively prompt AI coding tools is essential for maximizing their utility in identifying and resolving code issues.
Automated code quality and security analysis · Defect detection across multiple programming languages · Configurable quality gates for continuous integration
SonarQube is a leading platform for automated code quality management, essential for establishing and enforcing standards that prevent bugs.
As an Amazon Associate I earn from qualifying purchases. Prices may vary.
Catching bugs before execution
Static analysis is the process of examining code for potential errors without actually executing it. Traditional static analysis relies on predefined rules and patterns to identify issues. AI elevates this process by learning from vast codebases and identifying subtle anomalies that rule-based systems might miss.
AI-powered static analysis tools excel at finding a wide range of bugs, including null pointer exceptions, memory leaks, buffer overflows, and security vulnerabilities. They can also identify code smells – indicators of potential problems that might not be immediate bugs but could lead to issues down the line. Snyk Code and SonarQube are prime examples of tools that leverage AI in this domain.
The benefit of catching errors early in the development cycle is significant. Fixing bugs in production is far more costly and time-consuming than addressing them during development. Static analysis helps shift left, enabling developers to identify and resolve issues before they make their way into the deployed code. This reduces technical debt and improves overall software quality.
For example, an AI-powered static analyzer might detect a potential SQL injection vulnerability in a web application. By flagging this issue early, developers can address it before it’s exploited by attackers. This proactive approach to security is crucial in today’s threat landscape.
Real-time insights during runtime
Dynamic analysis, in contrast to static analysis, involves analyzing code while it’s running. This allows AI-powered tools to detect runtime errors, performance issues, and unexpected behavior that might not be apparent during static analysis. Tools like Airbrake and Memfault specialize in dynamic analysis.
AI techniques like anomaly detection are particularly valuable in dynamic analysis. These algorithms learn the normal behavior of a system and flag deviations as potential problems. This can be incredibly useful for identifying performance bottlenecks, memory leaks, and other runtime issues. Root cause analysis, also powered by AI, helps pinpoint the exact line of code causing a problem.
Consider a distributed system with multiple microservices. If a request fails, it can be difficult to determine which service is responsible. AI-powered dynamic analysis tools can trace the request across services, identify the point of failure, and provide detailed diagnostic information. This significantly reduces the time and effort required for troubleshooting.
The advantage of dynamic analysis is its ability to capture real-world behavior. However, it requires running the code, which can be challenging in complex environments. Combining static and dynamic analysis provides the most comprehensive approach to debugging.
- Anomaly Detection: Identifying deviations from expected behavior.
- Root Cause Analysis: Pinpointing the source of errors.
- Performance Profiling: Measuring code execution time and resource usage.
AI-Powered Runtime Error Detection Example
Modern AI debugging tools excel at identifying potential runtime errors before they occur in production. Here's a practical example showing how these tools analyze code patterns and suggest preventive fixes for common issues like division by zero errors.
def calculate_average(numbers):
    total = sum(numbers)
    count = len(numbers)
    # AI DEBUGGING TOOL HIGHLIGHT: Potential ZeroDivisionError
    # SUGGESTION: Add validation to check if count is zero
    average = total / count  # <- AI flagged this line
    return average

# Example usage that could trigger the error
result = calculate_average([])  # Empty list causes division by zero
print(f"Average: {result}")

# AI-SUGGESTED FIX:
def calculate_average_fixed(numbers):
    if not numbers:  # Guard clause added by AI suggestion
        return 0  # or raise ValueError("Cannot calculate average of empty list")

    total = sum(numbers)
    count = len(numbers)
    average = total / count
    return average
AI debugging tools like those in our top 10 list use machine learning models trained on millions of code repositories to recognize error-prone patterns. When analyzing this function, the AI immediately identifies the division operation as a potential risk point and suggests adding input validation. This proactive approach helps developers catch bugs during the development phase rather than discovering them through user reports or system crashes. The suggested fix demonstrates how AI tools don't just identify problems - they provide contextually appropriate solutions that follow best practices for error handling.
Debugging in the Cloud: Scalability and Collaboration
Cloud-based debugging tools are gaining popularity due to their scalability and collaborative features. These tools allow developers to debug large codebases and complex deployments without being limited by the resources of their local machines. Amazon CodeGuru is a prime example of a cloud-native debugging solution.
The ability to scale debugging environments on demand is a significant advantage. As applications grow in size and complexity, debugging can become a bottleneck. Cloud-based tools can automatically provision the necessary resources, ensuring that debugging doesn’t slow down the development process.
Collaborative debugging features enable multiple developers to work on the same problem simultaneously. This is particularly valuable for remote teams. Developers can share debugging sessions, review code changes, and collaborate on solutions in real-time. This streamlines the debugging process and reduces communication overhead.
Cloud debugging tools often integrate with CI/CD pipelines, allowing for automated testing and debugging as part of the deployment process. This ensures that bugs are caught early and that only high-quality code is released to production.
AI and Test-Driven Development
AI-powered debugging tools can complement test-driven development (TDD) by helping to generate test cases, identify gaps in test coverage, and analyze test results. TDD emphasizes writing tests before writing code, but creating comprehensive test suites can be time-consuming.
AI can automate the generation of test cases based on code analysis and historical data. By identifying potential edge cases and boundary conditions, AI can help developers create more robust and thorough tests. This reduces the risk of overlooking critical scenarios.
AI can also analyze test results to identify patterns and anomalies. For example, if a test consistently fails under certain conditions, AI can help pinpoint the root cause of the failure. This accelerates the debugging process and improves the quality of the tests.
Tools like SonarQube can provide insights into code coverage, highlighting areas that are not adequately tested. This helps developers prioritize their testing efforts and ensure that all critical code paths are covered.
- Automated test case generation
- Test coverage analysis
- Anomaly detection in test results
The Future of AI Debugging
The future of AI-powered debugging is bright. We can expect to see even more sophisticated AI techniques used to automate bug detection and resolution. Emerging trends like self-healing code, where AI automatically fixes bugs, are already being explored. AI-driven code optimization will also become more prevalent, improving performance and reducing resource consumption.
However, there are still challenges to overcome. Current AI techniques are not perfect and can sometimes produce false positives or miss subtle errors. The need for large training datasets and the interpretability of AI models are also ongoing concerns. Developers will need to understand the limitations of AI and use it as a tool to augment their own expertise, not replace it.
In the coming years, we can expect to see AI debugging tools become even more integrated with the entire software development lifecycle. From automated test case generation to proactive bug prevention, AI will play an increasingly important role in ensuring the quality and reliability of software. The tools will become more personalized, adapting to individual coding styles and project requirements.
Ultimately, the goal of AI debugging is to empower developers to build better software faster. By automating repetitive tasks and providing deeper insights into code behavior, AI can free up developers to focus on more creative and challenging aspects of their work.

No comments yet. Be the first to share your thoughts!