The linear memory constraint
WebAssembly uses a linear memory model—essentially a giant byte array. While this makes it portable, it lacks a garbage collector. You have to reclaim every byte you allocate manually.
The responsibility for managing this memory falls squarely on the developer. In Rust and C++, this means careful allocation and deallocation. When memory isn’t properly deallocated, it results in a memory leak. These leaks accumulate over time, eventually leading to performance degradation and even application crashes. The browser isolates WASM memory, so a leak doesn’t directly impact the host system, but it will kill the user experience.
The differences in how Rust and C++ handle memory are significant. Rust’s ownership system aims to prevent leaks at compile time, but as we’ll see, it’s not foolproof in a WASM environment. C++, on the other hand, relies heavily on manual memory management, which is prone to errors if not handled meticulously. Understanding these differences is crucial for effective debugging.
Where Rust ownership fails
Rust's ownership and borrowing system is often touted as a major advantage, and it is – most of the time. It prevents a whole class of memory errors that plague C and C++. However, when compiling to WASM and interacting with JavaScript, Rust's guarantees weaken. The biggest culprits are reference cycles involving `Rc` and `Arc`, and the use of `Box` with `#[wasm_bindgen]`.
`Rc` (Reference Counted) and `Arc` (Atomically Reference Counted) allow multiple owners of a single piece of data. This is useful, but if those owners form a cycle – A owns B, B owns A – the reference count will never reach zero, and the memory will never be freed. I’ve lost hours tracking down these cycles; they’re often hidden deep within complex data structures. The `Arc` type is needed when sharing ownership across threads which is less common in WASM, but still possible.
The `#[wasm_bindgen]` macro is essential for interoperability between Rust and JavaScript. When you pass a `Box` across the WASM/JavaScript boundary, Rust loses track of the memory ownership. JavaScript now owns the memory, but if JavaScript doesn’t explicitly free it, you have a leak. It's a subtle but critical point. I remember one project where we were creating a lot of DOM elements in Rust and passing them to JavaScript. We hadn't accounted for the fact that JavaScript wasn't releasing them, and the memory usage just kept climbing.
To mitigate these issues, be extremely careful when using `Rc` and `Arc`, and avoid passing `Box`es to JavaScript unless absolutely necessary. Consider using alternative data structures or ownership patterns that avoid reference cycles. If you must pass a `Box` to JavaScript, ensure there’s a corresponding mechanism for freeing the memory on the JavaScript side.
- Avoid using `Rc` and `Arc` when possible, especially in scenarios involving interaction with JavaScript.
- If you must use `Rc` or `Arc`, carefully analyze your data structures to prevent reference cycles.
- Pass data by value or use shared arrays instead of using Box with wasm_bindgen.
- If passing a `Box` to JavaScript, ensure a corresponding mechanism exists to free the memory on the JavaScript side.
Problematic Rust Code with Reference Cycles
Reference cycles are one of the most common causes of memory leaks in Rust applications compiled to WebAssembly. When using reference-counted smart pointers like Rc, circular references prevent the reference count from ever reaching zero, causing memory to never be freed. Here's a typical example that demonstrates this problem:
use std::rc::Rc;
use std::cell::RefCell;

// This structure creates a reference cycle that prevents proper cleanup
#[derive(Debug)]
struct Node {
    value: i32,
    parent: Option<Rc<RefCell<Node>>>,
    children: Vec<Rc<RefCell<Node>>>,
}

impl Node {
    fn new(value: i32) -> Rc<RefCell<Self>> {
        Rc::new(RefCell::new(Node {
            value,
            parent: None,
            children: Vec::new(),
        }))
    }

    fn add_child(&mut self, child: Rc<RefCell<Node>>) {
        // MEMORY LEAK: This creates a circular reference
        // Parent holds strong reference to child
        self.children.push(child.clone());

        // Child holds strong reference back to parent
        child.borrow_mut().parent = Some(Rc::new(RefCell::new(Node {
            value: self.value,
            parent: self.parent.clone(),
            children: self.children.clone(),
        })));
    }
}

// Function that demonstrates the leak when compiled to WASM
pub fn create_leaky_tree() {
    let parent = Node::new(1);
    let child1 = Node::new(2);
    let child2 = Node::new(3);

    // These operations create reference cycles
    parent.borrow_mut().add_child(child1.clone());
    parent.borrow_mut().add_child(child2.clone());

    // When this function ends, the Rc count never reaches zero
    // because parent references children and children reference parent
    // In WASM, this memory is never reclaimed
}
In this example, the Node structure creates a bidirectional relationship where parents hold strong references to their children, and children hold strong references back to their parents. When create_leaky_tree() finishes executing, the reference counts never drop to zero because of these circular dependencies. In a WebAssembly environment, this leaked memory accumulates over time and cannot be garbage collected like it would be in languages with automatic memory management. The next section will show you how to fix this using weak references and proper cleanup patterns.
C++ and WASM: Manual Memory Management Woes
C++’s manual memory management is a double-edged sword. It gives you fine-grained control, but it also places the entire burden of memory safety on the developer. When targeting WASM, these challenges are amplified. Forgetting to `delete` memory allocated with `new` is the most common mistake, leading to a classic memory leak. Double-freeing – deleting the same memory twice – is equally dangerous, often resulting in crashes.
The Resource Acquisition Is Initialization (RAII) idiom is your best friend in C++. RAII ensures that resources, like memory, are automatically released when an object goes out of scope. Smart pointers, like `std::unique_ptr` and `std::shared_ptr`, are implementations of RAII and can significantly reduce the risk of memory leaks. They manage the lifetime of the allocated memory automatically.
However, even with RAII and smart pointers, leaks can still occur, particularly when interacting with JavaScript through the Embind bindings (or similar). If you pass a raw pointer to JavaScript, C++ loses control of that memory. It’s crucial to ensure that JavaScript correctly manages and releases that memory. It's a similar problem to the `Box` scenario in Rust, but the consequences are potentially more severe due to C++’s lack of built-in safety nets.
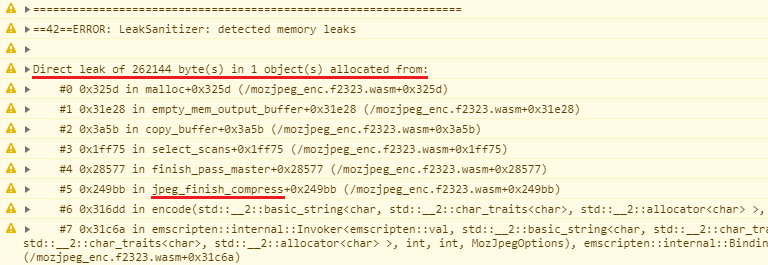
Debugging C++ memory leaks in WASM requires a disciplined approach. Use tools like Valgrind (though its WASM support is limited) or address sanitizers to detect leaks during development. And, of course, thorough code reviews are essential.
- Always pair `new` with `delete`.
- Use smart pointers to let RAII handle the cleanup automatically.
- Be extremely careful when passing raw pointers to JavaScript.
- Use memory debugging tools like Valgrind or address sanitizers during development.
Common C++ Memory Leak Pattern in WebAssembly
One of the most frequent causes of memory leaks in WebAssembly applications built with C++ is the classic pattern of allocating memory with `new` but forgetting to call `delete`. This becomes particularly problematic in WebAssembly because the memory grows within the browser's heap, and unlike native applications, there's no automatic cleanup when the program ends.
#include <iostream>
#include <emscripten.h>

class DataProcessor {
public:
    int* buffer;
    size_t size;

    DataProcessor(size_t bufferSize) {
        size = bufferSize;
        // Memory allocation - this creates a potential leak point
        buffer = new int[size];
        std::cout << "Allocated " << size << " integers" << std::endl;
    }

    void processData() {
        // Simulate some data processing
        for (size_t i = 0; i < size; i++) {
            buffer[i] = i * 2;
        }
    }

    // BUG: Missing destructor means memory is never freed
    // This causes a memory leak in WebAssembly
};

// Function exported to JavaScript
extern "C" {
    EMSCRIPTEN_KEEPALIVE
    void createProcessor() {
        // Each call creates a new processor but never cleans up
        DataProcessor* processor = new DataProcessor(1000);
        processor->processData();

        // BUG: processor is never deleted
        // Memory accumulates with each function call
        // delete processor; // This line is missing!
    }
}
In this example, the `DataProcessor` class allocates memory in its constructor but lacks a proper destructor to free it. Additionally, the `createProcessor` function creates new instances without ever deleting them. Each time JavaScript calls this function, more memory is allocated and never released, causing the WebAssembly memory to grow continuously. To fix this leak, you need to add a destructor to the class and ensure proper cleanup in the exported function.
Hunting leaks with Chrome DevTools
Chrome DevTools is an incredibly powerful tool for debugging WASM applications. The Memory panel is your primary weapon against memory leaks. You can use it to take heap snapshots – point-in-time captures of the WASM heap. By taking multiple snapshots over time, you can identify which objects are growing in number, indicating a potential leak.
To take a heap snapshot, open DevTools, navigate to the Memory panel, and select “Heap snapshot”. Click the “Take snapshot” button. After taking a snapshot, you can compare it to a previous snapshot to see what has changed. DevTools will show you the retained size of objects, which is a good indicator of memory usage. Look for objects that are unexpectedly large or numerous.
Interpreting heap snapshots can be challenging, but DevTools provides several filtering and sorting options. You can filter by constructor (to find objects of a specific type) or by retained size (to find the largest objects). You can also use the “Comparison” view to highlight the differences between two snapshots. Once you’ve identified a potential leak, you can trace the object’s references to find the source of the leak.
Let's say you suspect a leak related to strings. You'd take a heap snapshot, then another after performing the action you suspect is leaking. In the comparison view, filter by the string constructor. If you see a large number of strings accumulating, that's a strong indication of a leak. You can then investigate the code that creates those strings to find the problem.
The DevTools console also provides helpful commands for inspecting WASM memory. You can use the `wasm.heap()` function to access the WASM heap directly, but this is generally only useful for advanced debugging.
- Open Chrome DevTools and navigate to the Memory panel.
- Select “Heap snapshot” and click “Take snapshot”.
- Repeat the process multiple times to capture changes over time.
- Compare snapshots to identify growing objects.
- Use filters and sorting options to narrow down the search.
- Trace object references to find the source of the leak.
WASM Binary Analysis Tools
For more in-depth analysis, you can use tools like `wasm-objdump` and `wasm-dis` to examine the WASM binary itself. `wasm-objdump` provides a high-level overview of the WASM module, including its sections and exports. `wasm-dis` disassembles the WASM code into a human-readable format, allowing you to inspect the instructions.
These tools are particularly useful for understanding the memory layout and identifying potential issues that might not be apparent from the source code. For example, you can use `wasm-dis` to examine the memory access patterns and look for potential out-of-bounds accesses or incorrect memory offsets. It can also help you understand how data is structured in memory.
These tools are command-line based, so you’ll need to be comfortable with the terminal. They require some knowledge of WASM assembly language to interpret the output effectively. Resources like the WebAssembly specification and online tutorials can help you get started. The official WASM website () is a good place to begin.
While these tools are powerful, they're best suited for advanced debugging. Most of the time, Chrome DevTools will be sufficient to identify and fix memory leaks. However, when you encounter complex issues, or when you need to understand the underlying WASM code, these tools can be invaluable.
- wasm-objdump: Provides a high-level overview of the WASM module.
- wasm-dis: Disassembles the WASM code into a human-readable format.
- These tools are command-line based and require some knowledge of WASM assembly language.
- The official WebAssembly website () is a good resource for learning more.
WASM Analysis Tool Comparison (2026)
| Tool | Primary Use Case | Ease of Use | Output Format | Debugging Support |
|---|---|---|---|---|
| wasm-objdump | Binary inspection, overall structure | Moderate - requires understanding of WASM binary format | Textual disassembly, raw binary data | Limited - focuses on static analysis |
| wasm-dis | Human-readable disassembly | High - relatively straightforward to use | WebAssembly Text Format (WAT) | Good - WAT is easier to read and understand for debugging |
| Binaryen | Optimization, analysis, and tooling | Moderate to High - depends on the specific tool within Binaryen | WAT, WASM, C++ source code | Good - provides tools for both static and dynamic analysis |
| wasmtime | WASM runtime and debugging | Moderate - requires some familiarity with runtimes | Runtime output, limited textual disassembly | Excellent - offers runtime debugging features and profiling |
| Chrome DevTools | Browser-based debugging | High - integrated into a familiar browser environment | Source maps, disassembly, runtime state | Excellent - provides a comprehensive debugging experience for WASM in the browser |
| wabt (WebAssembly Binary Toolkit) | Various WASM tools (disassembly, validation, etc.) | Moderate - command-line focused | WAT, WASM | Moderate - useful for validating and inspecting WASM modules |
Illustrative comparison based on the article research brief. Verify current pricing, limits, and product details in the official docs before relying on it.
Debugging with wasmtime and other Runtimes
Debugging WASM doesn't always have to happen in the browser. Tools like `wasmtime` allow you to run WASM modules outside of a browser environment. This is invaluable for testing and isolating issues. You can then use traditional debuggers like GDB or LLDB to step through the WASM code and inspect its state.
Setting up `wasmtime` for debugging typically involves building your WASM module with debug symbols. Then, you can use the `wasmtime` command-line interface with the `--gdb` flag to start a GDB server. You can then connect to the GDB server with a GDB client and debug the WASM module as you would a native application.
The process for using LLDB is similar. `wasmtime` can also start an LLDB server, allowing you to connect with an LLDB client. The specific commands and configuration options may vary depending on your operating system and debugger version. Consult the `wasmtime` documentation for detailed instructions.
Debugging with `wasmtime` and a debugger like GDB or LLDB provides a more low-level view of the WASM code. This can be helpful for identifying subtle memory management issues that might not be apparent when debugging in the browser. It also allows you to test WASM modules in a controlled environment without the overhead of a browser.
Common Leak Patterns and How to Spot Them
Several common patterns contribute to memory leaks in WASM applications. One frequent culprit is forgetting to remove event listeners. If you add an event listener to a DOM element and then remove the element from the DOM without removing the listener, the listener will continue to exist in memory, preventing the element from being garbage collected. This is especially common in Rust when interacting with JavaScript.
Timers are another common source of leaks. If you set a timer using `setTimeout` or `setInterval` and don’t clear it with `clearTimeout` or `clearInterval`, the timer will continue to run indefinitely, preventing the associated callback function and any captured variables from being garbage collected. This often happens when components are unmounted but timers are still active.
Long-lived objects, such as caches or global variables, can also contribute to leaks if they accumulate data over time without being properly cleared. Be mindful of the data you store in these objects and ensure that you release any unused resources. I’ve seen projects where caches grew uncontrollably, eventually consuming all available memory.
To prevent these leaks, always remember to: remove event listeners when they’re no longer needed, clear timers when they’re no longer active, and periodically clear long-lived objects. Code reviews are critical for catching these types of errors. A simple checklist can be a lifesaver.
- Event Listeners: Always remove event listeners when the associated element is removed from the DOM.
- Timers: Clear timers with `clearTimeout` or `clearInterval` when they’re no longer needed.
- Long-Lived Objects: Periodically clear long-lived objects to release unused resources.
- JavaScript Interop: Ensure JavaScript correctly manages any memory passed from WASM.


No comments yet. Be the first to share your thoughts!