How ownership actually works
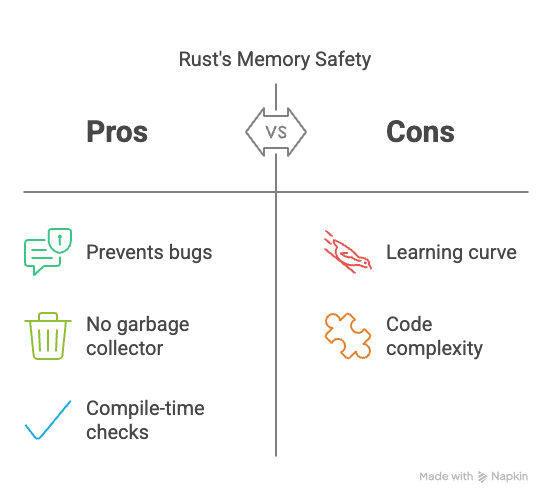
Rust handles memory through ownership rather than a garbage collector. The compiler checks three things: every value has one owner, you can borrow data temporarily, and references can't outlive the data they point to. If you break these rules, the code won't compile.
The benefit is a reduction in crashes and vulnerabilities related to memory. Dangling pointers, data races, and use-after-free errors—hallmarks of C and C++—are largely eliminated by the compiler. This doesn’t mean Rust is immune to all memory issues, however. The system requires diligence from the developer, and understanding its nuances is critical.
There's also `unsafe` Rust. This allows developers to bypass some of the safety checks when absolutely necessary, often for interacting with C libraries or performing low-level operations. `unsafe` code requires careful review and justification, as it effectively reintroduces the risks that Rust aims to avoid. It’s a powerful tool, but one that demands respect and a thorough understanding of memory management.
Where safety breaks down
Despite the borrow checker’s effectiveness, memory safety bugs can still occur in Rust code. Use-after-free errors, while less common than in languages without strict memory management, can arise when dealing with raw pointers or `unsafe` code. These typically happen when a pointer is dereferenced after the memory it points to has been deallocated.
Double-free errors, where the same memory is deallocated twice, are also possible, particularly within `unsafe` blocks. The borrow checker won't prevent this, as it's operating outside the bounds of its safety guarantees. These errors can lead to heap corruption and unpredictable program behavior.
Mutable borrow issues can also surface. While the borrow checker prevents multiple mutable borrows simultaneously, it's possible to create scenarios where a borrow outlives the data it references, or where a mutable borrow is unintentionally created, leading to unexpected data modification. These can be subtle and difficult to track down without careful analysis.
Debugging with `lldb` and GDB
When memory safety issues do occur, traditional debuggers like `lldb` (default on macOS) and GDB become invaluable. `lldb` and GDB allow you to step through your code line by line, inspect variables, and examine the call stack. To start debugging, compile your Rust code with debug symbols (`cargo build --debug`). Then, use `lldb target/debug/your_program` or `gdb target/debug/your_program` to launch the debugger.
Setting breakpoints is fundamental. `break main` will set a breakpoint at the beginning of your `main` function. You can then use `step` (or `s`) to execute one line at a time, `next` (or `n`) to step over function calls, and `continue` (or `c`) to resume execution until the next breakpoint. Inspecting variables using `print variable_name` is crucial for understanding the program's state.
When a memory safety error occurs, the backtrace is your best friend. Use `backtrace` (or `bt`) to see the sequence of function calls that led to the error. Examining memory addresses using `print &variable_name` and `x/10gx address` (in GDB) can help pinpoint the location of the problem. You can also attach the debugger to a running process using `lldb -p process_id` or `gdb -p process_id`.
- Run `cargo build` to generate debug symbols.
- Launch the debugger: `lldb target/debug/your_program` or `gdb target/debug/your_program`
- Set breakpoints: `break main`
- Step through code: `step` or `next`
- Inspect variables: `print variable_name`
- Examine backtrace: `backtrace`
Miri: The Rust Interpreter
Miri is a Rust interpreter specifically designed to detect undefined behavior. Unlike a traditional debugger, Miri doesn't just step through your code; it executes it in a controlled environment, carefully checking for violations of Rust's safety rules. This means it can catch issues the borrow checker misses, such as data races or out-of-bounds access.
Miri differs from debuggers in that it's slower. It simulates the execution of the code, which introduces overhead. However, this overhead is a trade-off for its ability to identify subtle memory safety issues. You run your code with `miri run`. It's especially useful for testing `unsafe` code and verifying its correctness.
Integrating Miri into a CI/CD pipeline is a good practice. While it might slow down your builds, the early detection of memory safety bugs can save significant time and effort in the long run. Be aware that Miri is constantly evolving and may have limitations in its coverage. It's not a silver bullet, but it's a powerful tool in the Rust developer’s arsenal.
Valgrind and Memory Sanitizers
Valgrind, particularly its Memcheck tool, is a dynamic analysis tool that can detect memory errors like invalid reads and writes, memory leaks, and use of uninitialized memory. To use Valgrind, you’ll need to install it separately (e.g., `brew install valgrind` on macOS, or `apt install valgrind` on Debian/Ubuntu). Then, run your program with `valgrind --leak-check=full target/debug/your_program`.
Rust also provides built-in memory sanitizers, enabled with the `-Z sanitizer=memory` flag during compilation (e.g., `cargo build -Z sanitizer=memory --debug`). These sanitizers instrument your code to detect memory errors at runtime. They’re generally faster than Valgrind but may have less comprehensive coverage.
Interpreting the output from Valgrind or the memory sanitizer can be challenging. They often report detailed information about the error, including the memory address, the type of error, and the call stack. Understanding this output requires some experience, but it's crucial for identifying the root cause of the memory safety violation. Look for patterns and focus on the areas of code where the errors are reported.
Static analysis and clippy
Static analysis tools examine your code without actually running it, looking for potential problems. Clippy is a popular linter for Rust that provides a wealth of suggestions for improving code quality and preventing bugs. It can identify common mistakes, such as unused variables, potential memory leaks, and inefficient code.
Rustfmt is a code formatter that automatically formats your code according to a consistent style. While it doesn't directly prevent memory safety issues, it can improve code readability and make it easier to spot potential problems. Configure these tools using a `clippy.toml` and `rustfmt.toml` file in your project.
Several Clippy lints are specifically related to memory safety. For example, the `borrowed_object_lifetime` lint checks for potential issues with borrowed objects outliving their data. Regularly running Clippy and Rustfmt can help you catch memory safety issues early in the development process and maintain a clean, consistent codebase.
Annotated Rust Backtrace Example
When a Rust program encounters a memory safety violation or panic, it generates a detailed backtrace that provides crucial debugging information. Understanding how to read and interpret these backtraces is essential for identifying the root cause of memory safety bugs.
thread 'main' panicked at 'index out of bounds: the len is 3 but the index is 5', src/main.rs:12:13
note: run with `RUST_BACKTRACE=1` environment variable to display a backtrace

stack backtrace:
   0: rust_begin_unwind
             at /rustc/d5c2e9c342b358556da91d61ed4133f6f50fc0c3/library/std/src/panicking.rs:593:5
   1: core::panicking::panic_fmt
             at /rustc/d5c2e9c342b358556da91d61ed4133f6f50fc0c3/library/core/src/panicking.rs:67:14
   2: core::panicking::panic_bounds_check
             at /rustc/d5c2e9c342b358556da91d61ed4133f6f50fc0c3/library/core/src/panicking.rs:162:5
   3: <usize as core::slice::SliceIndex<[T]>>::index
             at /rustc/d5c2e9c342b358556da91d61ed4133f6f50fc0c3/library/core/src/slice/index.rs:261:10
   4: core::slice::index::<impl core::ops::index::Index<I> for [T]>::index
             at /rustc/d5c2e9c342b358556da91d61ed4133f6f50fc0c3/library/core/src/slice/index.rs:18:9
   5: <alloc::vec::Vec<T> as core::ops::index::Index<I>>::index
             at /rustc/d5c2e9c342b358556da91d61ed4133f6f50fc0c3/library/alloc/src/vec/mod.rs:2727:9
   6: my_app::process_data
             at ./src/main.rs:12:13
   7: my_app::main
             at ./src/main.rs:6:5
   8: core::ops::function::FnOnce::call_once
             at /rustc/d5c2e9c342b358556da91d61ed4133f6f50fc0c3/library/core/src/ops/function.rs:250:5
This backtrace reveals several key pieces of information: The panic message indicates an index out of bounds error at line 12 in main.rs. Frame 6 shows our application code (my_app::process_data) where the actual bug occurred. Frames 7-8 trace back through the call stack to show how we reached the failing function. Frames 0-5 represent internal Rust library code handling the panic and bounds checking. The file paths and line numbers in your application code (frames 6-7) are where you should focus your debugging efforts, while the standard library frames help confirm the type of memory safety violation that occurred.
Community Resources & Debugging Strategies
The Rust documentation (doc.rust-lang.org) is an excellent starting point for learning about memory safety and debugging techniques. The Rust Reference provides detailed explanations of ownership, borrowing, and lifetimes. The Rust By Example website offers practical examples of how to use various Rust features, including debugging tools.
The Rust users forum is the best place to post a backtrace when you're stuck. Most ownership issues have been discussed there already, so searching for your specific compiler error usually turns up a solution.
Experienced Rust developers often recommend a systematic approach to debugging. Start by simplifying the problem, isolating the code that's causing the issue, and adding logging statements to track the program's state. Don't be afraid to experiment and try different approaches. Remember to carefully review `unsafe` code and consider using tools like Miri to verify its correctness.


No comments yet. Be the first to share your thoughts!