how wasm handles memory
WebAssembly uses linear memory, which is just a big, contiguous block of bytes. Unlike JavaScript, there is no garbage collector to clean up after you. You get direct control over every byte, which makes your code fast, but it also means you can easily leak memory if you lose track of your pointers.
Unlike JavaScript, WASM doesn’t automatically reclaim unused memory. Developers are responsible for explicitly allocating and deallocating memory using functions like `malloc` and `free` (or their equivalents in languages compiling to WASM). This explicit control is powerful, but it also means that forgetting to free allocated memory leads to a leak.
Linear memory can grow, but it has limits. When your module needs more space, it asks the browser for another page. Your allocator—usually something like dlmalloc—then carves that page into smaller blocks. If you don't understand how your allocator talks to the host, you'll have a hard time finding where the bytes are disappearing.
where the leaks usually hide
Memory leaks in WebAssembly aren’t bugs in the WASM runtime itself, but rather errors in the code compiled to WASM. One of the most common causes is simply failing to `free` memory that was allocated with `malloc`. For example, a C++ function might allocate a buffer, perform some operations on it, and then return without releasing the buffer. This memory remains allocated, even though it’s no longer being used.
Another frequent pattern involves orphaned objects. This occurs when an object is no longer reachable from any active part of the program, but the memory it occupies isn’t released. This can happen with complex data structures and pointer manipulation. Consider a scenario where a node is removed from a linked list, but a pointer to that node still exists elsewhere in the code; the node is orphaned, but the memory isn't freed.
Circular references can also lead to leaks, particularly in languages with garbage collection that are compiled to WASM. While WASM itself doesn't have garbage collection, languages like Rust or C++ might use it internally. If two or more objects reference each other in a cycle, the garbage collector might not be able to identify them as unreachable, leading to a leak. This is less common, but still a potential issue.
- Dangling pointers from forgotten free() calls
- Orphaned objects: Objects no longer reachable but not freed.
- Circular references in languages like Rust or C++ that use internal reference counting
Memory Leak Example in C++ for WebAssembly
The following C++ code demonstrates a common memory leak pattern that can occur in WebAssembly applications. This example shows how allocated memory is never freed, leading to progressive memory consumption that persists throughout the application lifecycle.
#include <stdlib.h>
#include <emscripten.h>

// Function that demonstrates a memory leak
EMSCRIPTEN_KEEPALIVE
void process_data(int size) {
    // Allocate memory for processing
    char* buffer = (char*)malloc(size * sizeof(char));

    if (buffer == NULL) {
        return; // Failed allocation
    }

    // Simulate data processing
    for (int i = 0; i < size; i++) {
        buffer[i] = (char)(i % 256);
    }

    // MEMORY LEAK: Missing free() call
    // The allocated memory is never released
    // Each call to this function leaks 'size' bytes

    // free(buffer); // This line should be uncommented to fix the leak
}

// Function called multiple times, accumulating memory leaks
EMSCRIPTEN_KEEPALIVE
void simulate_memory_leak() {
    for (int i = 0; i < 100; i++) {
        process_data(1024); // Each call leaks 1KB
    }
    // Total leak: 100KB after this function completes
}
In this example, the process_data function allocates memory using malloc but never calls the corresponding free function. Each invocation of simulate_memory_leak creates 100KB of leaked memory that cannot be reclaimed by the WebAssembly runtime. The EMSCRIPTEN_KEEPALIVE attribute ensures these functions remain accessible from JavaScript, making them suitable for testing memory leak detection tools. To fix this leak, uncomment the free(buffer) line at the end of the process_data function.
Chrome DevTools for WASM Debugging
Chrome DevTools provides excellent support for debugging WebAssembly, especially with its Memory inspector. To access it, open the DevTools (F12 or Ctrl+Shift+I), navigate to the 'Memory' tab, and select 'WebAssembly' from the left-hand panel. This allows you to view the linear memory of your WASM module as a raw byte array.
The Memory inspector lets you observe memory usage over time. If you see memory consistently increasing during program execution, it’s a strong indicator of a leak. You can also set breakpoints within your WASM code and step through instructions to pinpoint the exact location of memory allocations. The DevTools documentation at developer.chrome.com is a valuable resource for learning these features.
To effectively use breakpoints, you’ll need a source map – a file that maps the WASM code back to your original source code (e.g., C++). This allows you to debug the code in a more familiar environment. DevTools will show you the values of variables and registers at each breakpoint, helping you understand the state of the program and identify potential issues. The 'Sources' panel in DevTools is where you manage source maps.
Memory Snapshots and Comparison
Chrome DevTools enables you to take memory snapshots, which capture the state of the linear memory at a specific point in time. To take a snapshot, click the 'Take snapshot' button in the Memory inspector. You can then take another snapshot after performing a specific operation that you suspect might be leaking memory.
Comparing these snapshots allows you to identify memory growth. DevTools will highlight the differences between the snapshots, showing you which memory regions have been allocated since the previous snapshot. This provides a concrete way to pinpoint the source of the leak. Look for allocations that occur repeatedly without corresponding deallocations.
Snapshots are just still photos. If your leak only happens during a specific user interaction or involves short-lived objects that vanish before you click the button, a snapshot won't show them. I usually combine these with breakpoints to see exactly what's happening in the heap at the moment of allocation.
- Take a first snapshot.
- Perform the operation suspected of causing a leak.
- Take a second snapshot.
- Compare the snapshots to identify memory growth.
how to stop leaks before they start
Preventing memory leaks is always preferable to debugging them after the fact. If your source language supports smart pointers (like C++’s `std::unique_ptr` and `std::shared_ptr`), use them extensively. Smart pointers automatically manage memory deallocation, reducing the risk of leaks. They enforce ownership rules and ensure that memory is freed when it’s no longer needed.
Careful memory management practices are also essential. Always pair `malloc` with `free`, and ensure that every allocated block of memory is eventually deallocated. Avoid unnecessary allocations – reuse existing buffers whenever possible. Consider using memory pools to manage frequently allocated and deallocated objects.
Code reviews are a valuable tool for identifying potential memory leaks. A fresh pair of eyes can often spot errors that you might miss. Thorough testing, including unit tests and integration tests, is also crucial. Write tests that specifically check for memory leaks by monitoring memory usage over time.
- Use smart pointers when available.
- Always pair `malloc` with `free`.
- Avoid unnecessary allocations.
- Conduct thorough code reviews.
- Implement comprehensive testing.
Advanced Techniques: ASan and WASI
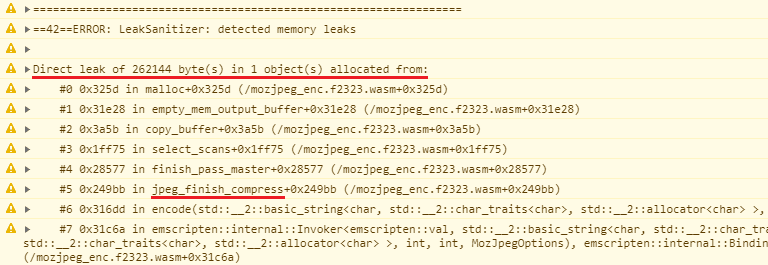
AddressSanitizer (ASan) is a powerful tool for detecting memory errors during development. It can identify a wide range of issues, including memory leaks, use-after-free errors, and buffer overflows. ASan works by instrumenting your code at compile time, adding checks to detect memory errors as they occur. This requires recompiling your WASM module with ASan enabled.
The WebAssembly System Interface (WASI) is an emerging standard that aims to provide a more secure and portable way to interact with the host environment. WASI includes features that can help improve memory safety, such as stricter memory management rules and better isolation between WASM modules and the host. While WASI is still under development, it has the potential to significantly reduce the risk of memory leaks and other security vulnerabilities.
These are more advanced techniques that require a deeper understanding of WASM and its ecosystem. They aren’t essential for basic debugging, but they can be valuable tools for building more robust and secure WASM applications.


No comments yet. Be the first to share your thoughts!