How Rust handles memory
Rust distinguishes itself in systems programming with a strong focus on memory safety. Unlike languages like C and C++, Rust aims to eliminate entire classes of bugs related to memory access. This isn’t achieved through a garbage collector, which introduces runtime overhead, but through a unique system of ownership, borrowing, and lifetimes.
The core idea is that every value in Rust has an owner. There can only be one owner at a time. When the owner goes out of scope, the value is dropped, and its memory is freed. This prevents dangling pointers and memory leaks. Borrowing allows multiple read-only references, or one mutable reference, to a value, ensuring data consistency.
Lifetimes define the scope for which a reference is valid. The compiler checks these lifetimes at compile time to ensure that references never outlive the data they point to. This static analysis is a key component of Rust’s memory safety guarantees. It's a significant departure from manual memory management, but it results in a safer, more reliable codebase.
C and C++ often fail because they rely on manual memory management. Rust replaces that manual burden with compile-time checks. You get the speed of a low-level language without the constant threat of a segmentation fault.

Where safety breaks down
Despite Rust’s strong guarantees, it’s still possible to encounter memory safety issues, particularly when interacting with unsafe code or dealing with complex data structures. One common problem is creating a dangling pointer, where a reference points to memory that has already been freed. While Rust's borrow checker prevents this in safe code, it can happen within `unsafe` blocks.
Data races occur when multiple threads access the same memory location concurrently, with at least one of them writing. This can lead to unpredictable behavior and is notoriously difficult to debug. Rust’s ownership system helps prevent data races, but they can still occur with shared mutable state if proper synchronization mechanisms aren't used.
Iterator invalidation happens when you modify a collection while iterating over it. This can lead to crashes or incorrect results. Rust’s iterators are designed to be safe, but it’s still possible to invalidate them if you’re not careful. The compiler often catches these issues, but not always.
These errors don’t always manifest as immediate crashes. Sometimes, they lead to subtle bugs that are difficult to reproduce. A dangling pointer might corrupt data silently, while a data race might only occur under specific conditions. The symptoms can range from incorrect output to unexpected program termination.
- Dangling pointers occur when you deallocate memory but keep a reference to it.
- Data Race: Multiple threads access and modify the same memory location concurrently without proper synchronization.
- Iterator Invalidation: Modifying a collection while iterating over it, leading to undefined behavior.
Use-After-Free Prevention Example
The following code demonstrates how Rust's borrow checker prevents use-after-free errors at compile time. This example shows what would be a dangerous memory safety violation in C or C++, but Rust catches it during compilation.
fn main() {
    // Create a vector with some data
    let mut data = vec![1, 2, 3, 4, 5];

    // Get a reference to the first element
    let first_element = &data[0];

    // This operation invalidates all existing references to the vector's contents
    // because it may cause reallocation of the underlying memory
    data.push(6);

    // UNSAFE: Attempting to use the reference after the vector has been modified
    // This would be a use-after-free error in languages without borrow checking
    // Rust prevents this at compile time with: "cannot borrow `data` as mutable
    // because it is also borrowed as immutable"
    println!("First element: {}", first_element);
}
When you attempt to compile this code, Rust's borrow checker will produce a compile-time error preventing the use-after-free condition. The error occurs because the reference `first_element` is still active when we try to modify the vector with `push()`. In unsafe languages, this could lead to accessing deallocated memory, but Rust's ownership system ensures memory safety by detecting these conflicts before runtime.
Using the compiler as a shield
Rust's compiler is your most powerful tool for preventing memory safety errors. It enforces the rules of ownership, borrowing, and lifetimes at compile time, catching many potential issues before your code even runs. Understanding how to interpret compiler error messages is crucial for effective debugging.
Borrow checker errors can be notoriously difficult to decipher at first. However, they usually point to violations of the borrowing rules. Pay close attention to the lifetime annotations and try to understand why the compiler thinks a reference is invalid. The error messages often provide hints about the specific problem.
Run `cargo clippy` regularly. It catches logic flaws that the standard compiler ignores, like unnecessary clones or suspicious pointer casts in unsafe blocks.
Fixing compiler errors is almost always the best way to debug memory safety problems. It’s far better to prevent an error from occurring in the first place than to spend hours tracking it down at runtime. Treat compiler errors as valuable feedback and use them to improve your code.
- Read compiler error messages carefully – they often contain hints.
- Enable `clippy` for additional checks and style guidance.
- Understand ownership, borrowing, and lifetimes to avoid common pitfalls.
Debugging with `gdb` and `lldb`
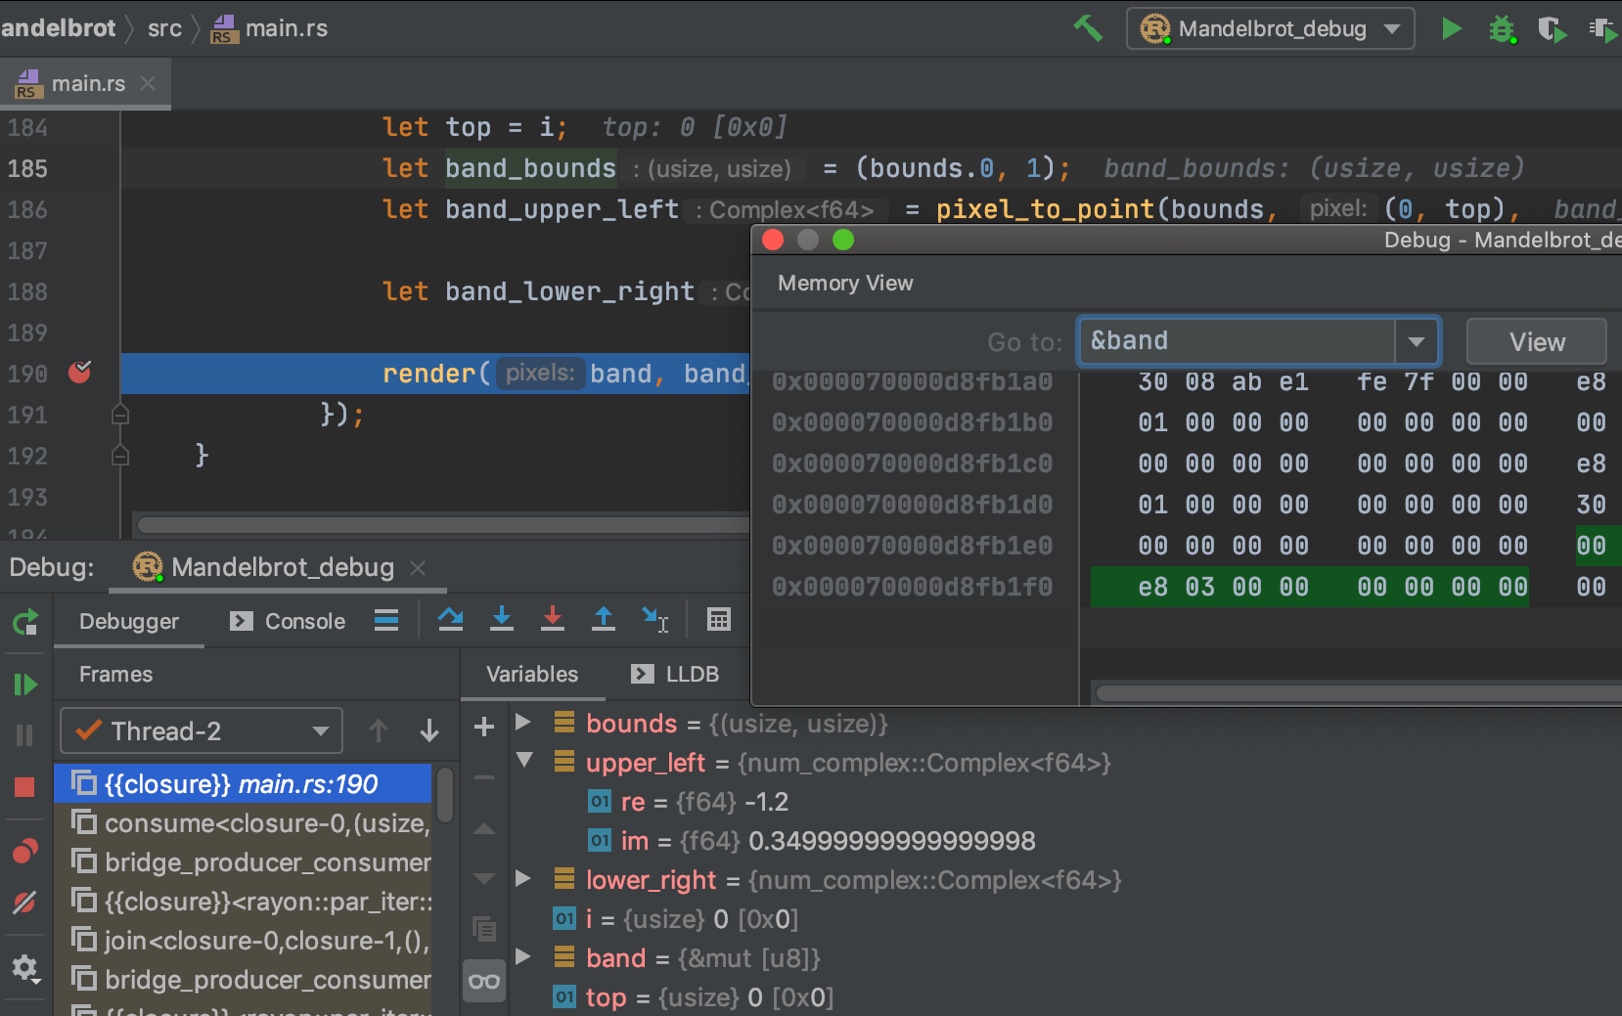
When compiler errors aren’t enough, you’ll need to use a debugger to step through your code and inspect its state. `gdb` (GNU Debugger) and `lldb` (Low Level Debugger) are two popular choices for debugging Rust programs. The Rust documentation details debugger attributes to enhance the debugging experience.
To start debugging, compile your code with debug symbols (using the `--debug` flag in Cargo). Then, launch `gdb` or `lldb` and attach it to the running process. You can set breakpoints at specific lines of code to pause execution and inspect variables.
Stepping through code allows you to observe the flow of execution and see how values change over time. Use commands like `next` (step over) and `step` (step into) to navigate your code. Inspecting variables lets you examine their values and identify potential problems.
Stack traces are invaluable for identifying the source of errors. They show the sequence of function calls that led to the current point of execution. Analyzing the stack trace can help you pinpoint the exact location where a memory safety error occurred. Users on users.rust-lang.org frequently recommend attaching a debugger to a running PID for inspection.
Memory Sanitizers: `msan` and `ubsan`
Memory sanitizers are runtime tools that detect memory safety violations. They work by instrumenting your code to check for common errors, such as out-of-bounds access and use-after-free. `msan` (MemorySanitizer) and `ubsan` (UndefinedBehaviorSanitizer) are two particularly useful sanitizers.
`msan` specifically detects memory safety errors, such as reading or writing to uninitialized memory. `ubsan` detects a broader range of undefined behavior, including integer overflows and shifts. Enabling these sanitizers requires recompiling your code with specific flags.
To enable `msan` and `ubsan`, you typically need to pass flags to the Rust compiler (usually through Cargo’s `build.rs` file). The exact flags may vary depending on your platform and compiler version. Consult the documentation for your specific setup.
The output from these sanitizers can be verbose, but it provides valuable information about the location and type of memory safety violation. Pay attention to the addresses and stack traces to pinpoint the source of the error. They can be a lifesaver when dealing with subtle bugs.
Comparison of Memory Sanitizers: MSAN vs. UBSAN for Rust
| Error Types Detected | Performance Overhead | Ease of Use | Setup Complexity |
|---|---|---|---|
| Use-after-free, out-of-bounds reads/writes (heap) | Generally Higher | Moderate | Moderate |
| Integer overflows, out-of-bounds reads/writes (stack), alignment issues, undefined behavior | Generally Lower | Moderate | Moderate |
| Uninitialized memory reads (heap and stack) | Significant | Moderate | Higher |
| Data races (with appropriate instrumentation) | High | Complex | High |
| Detects a broader range of undefined behavior | Variable, depends on checks enabled | Moderate | Moderate |
| Better for identifying heap-specific memory errors | Higher | Moderate | Moderate |
| Trade-off: MSAN provides more precise error reporting for specific heap issues, while UBSAN offers wider coverage. | Variable | Comparable | Comparable |
Qualitative comparison based on the article research brief. Confirm current product details in the official docs before making implementation choices.
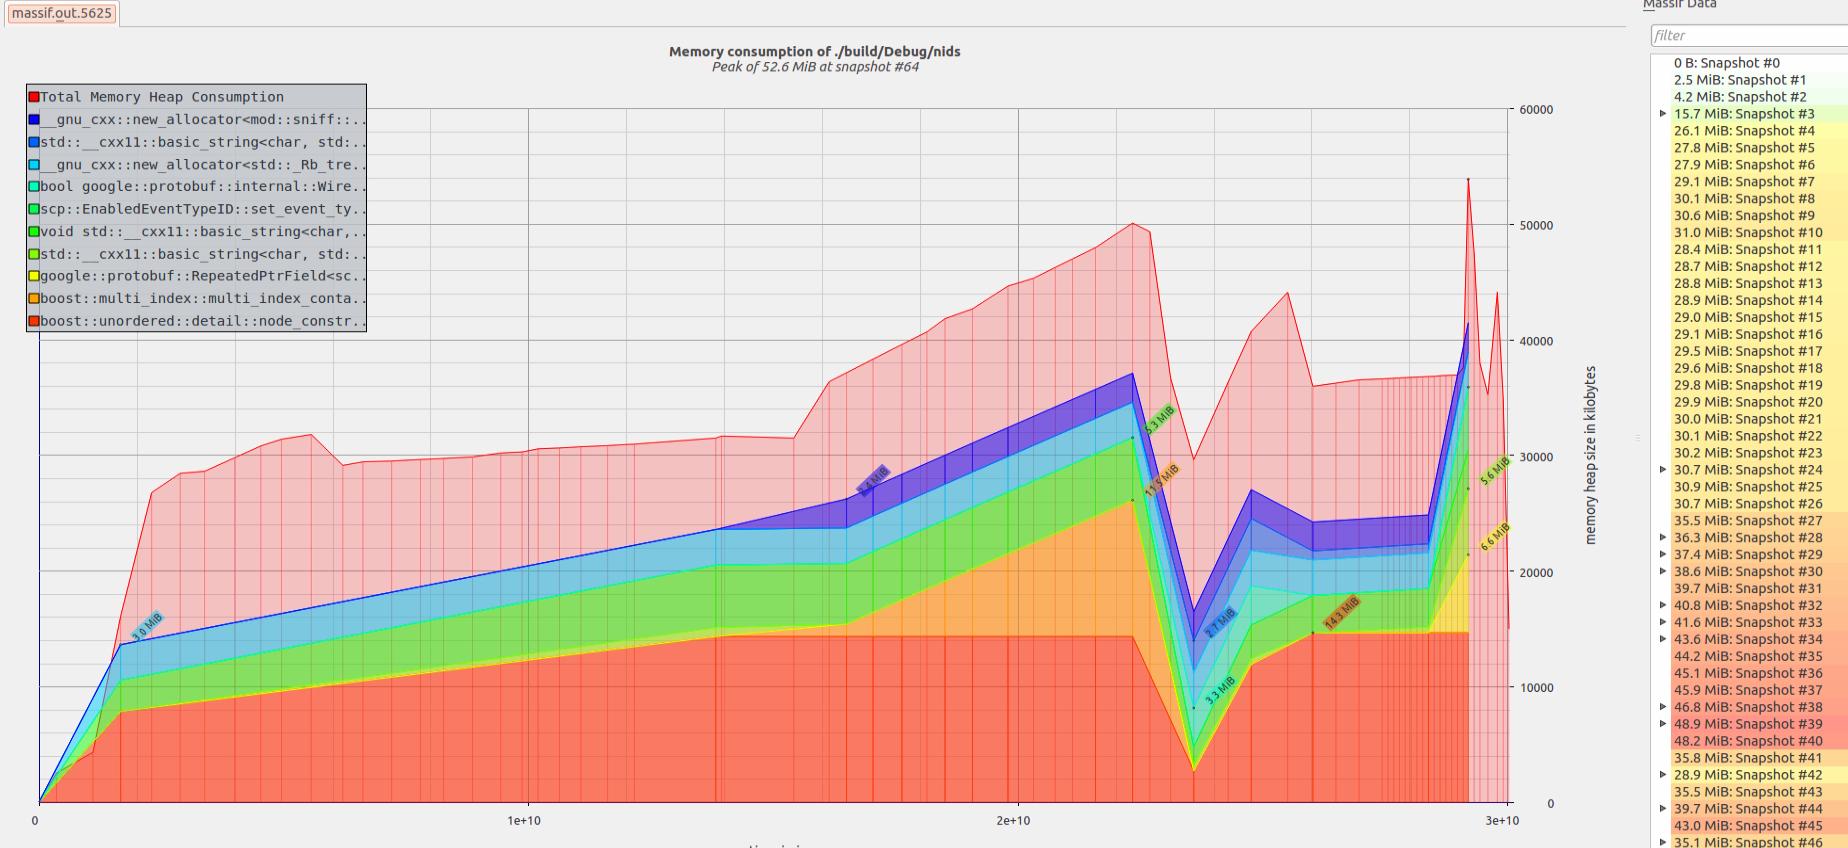
Profiling and Heap Analysis
Profiling and heap analysis tools help you identify memory leaks and excessive memory usage. These tools can be particularly useful for optimizing performance and preventing out-of-memory errors. `perf` (Linux) and Instruments (macOS) are two popular choices.
`perf` is a powerful profiling tool that can collect a wide range of performance data, including CPU usage, memory allocations, and cache misses. Instruments (on macOS) provides a graphical interface for analyzing performance data and identifying bottlenecks.
Integrating these tools with Rust typically involves compiling your code with profiling enabled and then running the profiler while your program is executing. The output from these tools can be complex, but it provides valuable insights into your program’s memory behavior.
Interpreting the output requires understanding concepts like call graphs, hot spots, and memory allocation patterns. Look for functions that are allocating a lot of memory or that are being called frequently. These are often good candidates for optimization. Identifying memory leaks is also critical – allocations that aren’t being freed represent a potential problem.
Essential Tools for Rust Memory Safety Debugging
Detects memory errors such as use-after-free, double-free, and memory leaks. · Provides detailed stack traces for detected memory issues. · Can profile memory usage to identify allocation patterns.
Valgrind is a powerful dynamic analysis tool essential for detecting runtime memory errors in C/C++ applications, and its principles are highly relevant for understanding memory behavior in Rust.

Supports setting breakpoints, stepping through code, and inspecting variables. · Allows examination of program state, including memory contents. · Integrates with various build systems and compilers.
GDB is a fundamental source-level debugger that enables granular control over program execution, crucial for stepping through Rust code and analyzing memory states.

Provides real-time code analysis and diagnostics. · Offers intelligent code completion and refactoring. · Supports Rust-specific features like macros and type inference.
Rust-analyzer is a de facto standard Language Server Protocol (LSP) implementation for Rust, offering comprehensive code analysis and diagnostics directly within the IDE.
Offers integrated debugging capabilities for Rust projects. · Provides advanced code navigation and analysis features. · Supports integration with build tools like Cargo.
The CLion Rust plugin enhances the CLion IDE with robust Rust support, including debugging features that aid in identifying and resolving memory safety issues.
As an Amazon Associate I earn from qualifying purchases. Prices may vary.
Error Handling and `panic!`
Rust provides robust error handling mechanisms through the `Result` type and the `panic!` macro. `Result` is used for recoverable errors, allowing you to handle errors gracefully. `panic!` is used for unrecoverable errors, such as logic errors or unexpected conditions.
Using `panic!` effectively is important for preventing program crashes. When a `panic!` occurs, the program unwinds the stack and calls any registered panic handlers. You can use `catch_unwind` to catch panics and prevent them from propagating up the call stack.
Carefully consider when to use `panic!` versus `Result`. `panic!` should be reserved for truly unrecoverable errors; otherwise, use `Result` to handle errors gracefully. This allows your program to recover from errors and continue executing.
The YouTube video “Panic!, Unrecoverable Errors and Debugging in Rust” provides a detailed overview of error handling in Rust, including how to use `panic!` and `catch_unwind`. Understanding these concepts is essential for writing robust and reliable code.
Using catch_unwind for Panic Recovery
The catch_unwind function provides a mechanism to catch panics and prevent them from terminating your program. This is particularly useful when dealing with potentially unsafe operations or when you need to maintain program stability despite encountering unexpected conditions.
use std::panic;

fn potentially_panicking_function() -> Result<i32, &'static str> {
    // Simulate a condition that might cause a panic
    let data = vec![1, 2, 3];

    // This will panic if index is out of bounds
    let result = data[10]; // This line will panic
    Ok(result)
}

fn safe_memory_operation() {
    // Use catch_unwind to handle potential panics gracefully
    let result = panic::catch_unwind(|| {
        potentially_panicking_function()
    });

    match result {
        Ok(value) => {
            match value {
                Ok(data) => println!("Operation successful: {}", data),
                Err(e) => println!("Function returned error: {}", e),
            }
        },
        Err(panic_info) => {
            // Handle the panic without crashing the entire program
            println!("Caught panic! Program continues running.");

            // Attempt to extract panic message if available
            if let Some(message) = panic_info.downcast_ref::<&str>() {
                println!("Panic message: {}", message);
            } else if let Some(message) = panic_info.downcast_ref::<String>() {
                println!("Panic message: {}", message);
            } else {
                println!("Panic occurred but message is not available");
            }
        }
    }
}

fn main() {
    println!("Starting memory-safe operation...");

    // This will catch the panic and prevent program termination
    safe_memory_operation();

    println!("Program continues after potential panic");

    // Demonstrate multiple operations with panic handling
    for i in 0..3 {
        println!("\nAttempt {}", i + 1);
        let result = panic::catch_unwind(|| {
            if i == 1 {
                panic!("Simulated panic on attempt 2");
            }
            println!("Operation {} completed successfully", i + 1);
        });

        if result.is_err() {
            println!("Caught panic on attempt {}, continuing...", i + 1);
        }
    }

    println!("\nAll operations completed. Program terminating normally.");
}
This example demonstrates how catch_unwind captures panics that would otherwise terminate the program. The function returns a Result type where Ok contains the successful execution result, and Err contains panic information. Note that catch_unwind should be used sparingly, as panics typically indicate programming errors that should be fixed rather than caught. However, it can be valuable in scenarios where you need to isolate potentially problematic code sections or when interfacing with external systems that might cause unexpected panics.


No comments yet. Be the first to share your thoughts!