The shift to automated fixes
Debugging used to mean staring at a blinking cursor, setting breakpoints one by one, and hunting through stack traces. It was a slow, manual process that often interrupted your flow for hours. Today, that changes. AI debugging tools don't just highlight errors; they analyze the context and suggest fixes instantly.
This shift moves us from reactive troubleshooting to proactive resolution. Instead of spending time identifying the root cause, you spend time verifying the solution. These tools act like an experienced pair programmer who has already seen the bug before.
The best tools in 2026 integrate directly into your IDE, understanding your entire codebase rather than just a single file. They catch syntax errors, logic flaws, and even security vulnerabilities before you run the code. This means fewer broken builds and faster deployment cycles.
For developers at any level, this means less frustration and more building. You focus on the architecture and features that matter, while the AI handles the tedious work of finding where things went wrong. It is not about replacing your skills; it is about amplifying them.
5 Best AI Debugging Tools for 2026 to Fix Code Faster
Debugging shouldn't feel like a guessing game, especially when your deadlines are tight. We’ve tested the top AI-powered tools to help you spot bugs faster and keep your code clean. Here are the five best options to streamline your workflow in 2026.
1. GitHub Copilot for automated fixes
GitHub Copilot acts like a pair programmer who never sleeps, instantly suggesting code completions and fixing syntax errors as you type. Its integrated terminal commands streamline workflow, while its ability to explain complex logic helps junior developers grasp underlying concepts quickly. This tool reduces context-switching, allowing teams to maintain momentum during tedious debugging sessions without losing focus on the broader architectural goals.

2. Amazon CodeWhisperer for security
Amazon CodeWhisperer prioritizes code safety by scanning for vulnerabilities and suggesting secure coding practices in real-time. It integrates seamlessly with major IDEs, offering language-specific recommendations that help developers avoid common security pitfalls like SQL injection or hardcoded credentials. This proactive approach ensures that applications remain robust against threats while maintaining high performance standards during the development lifecycle.

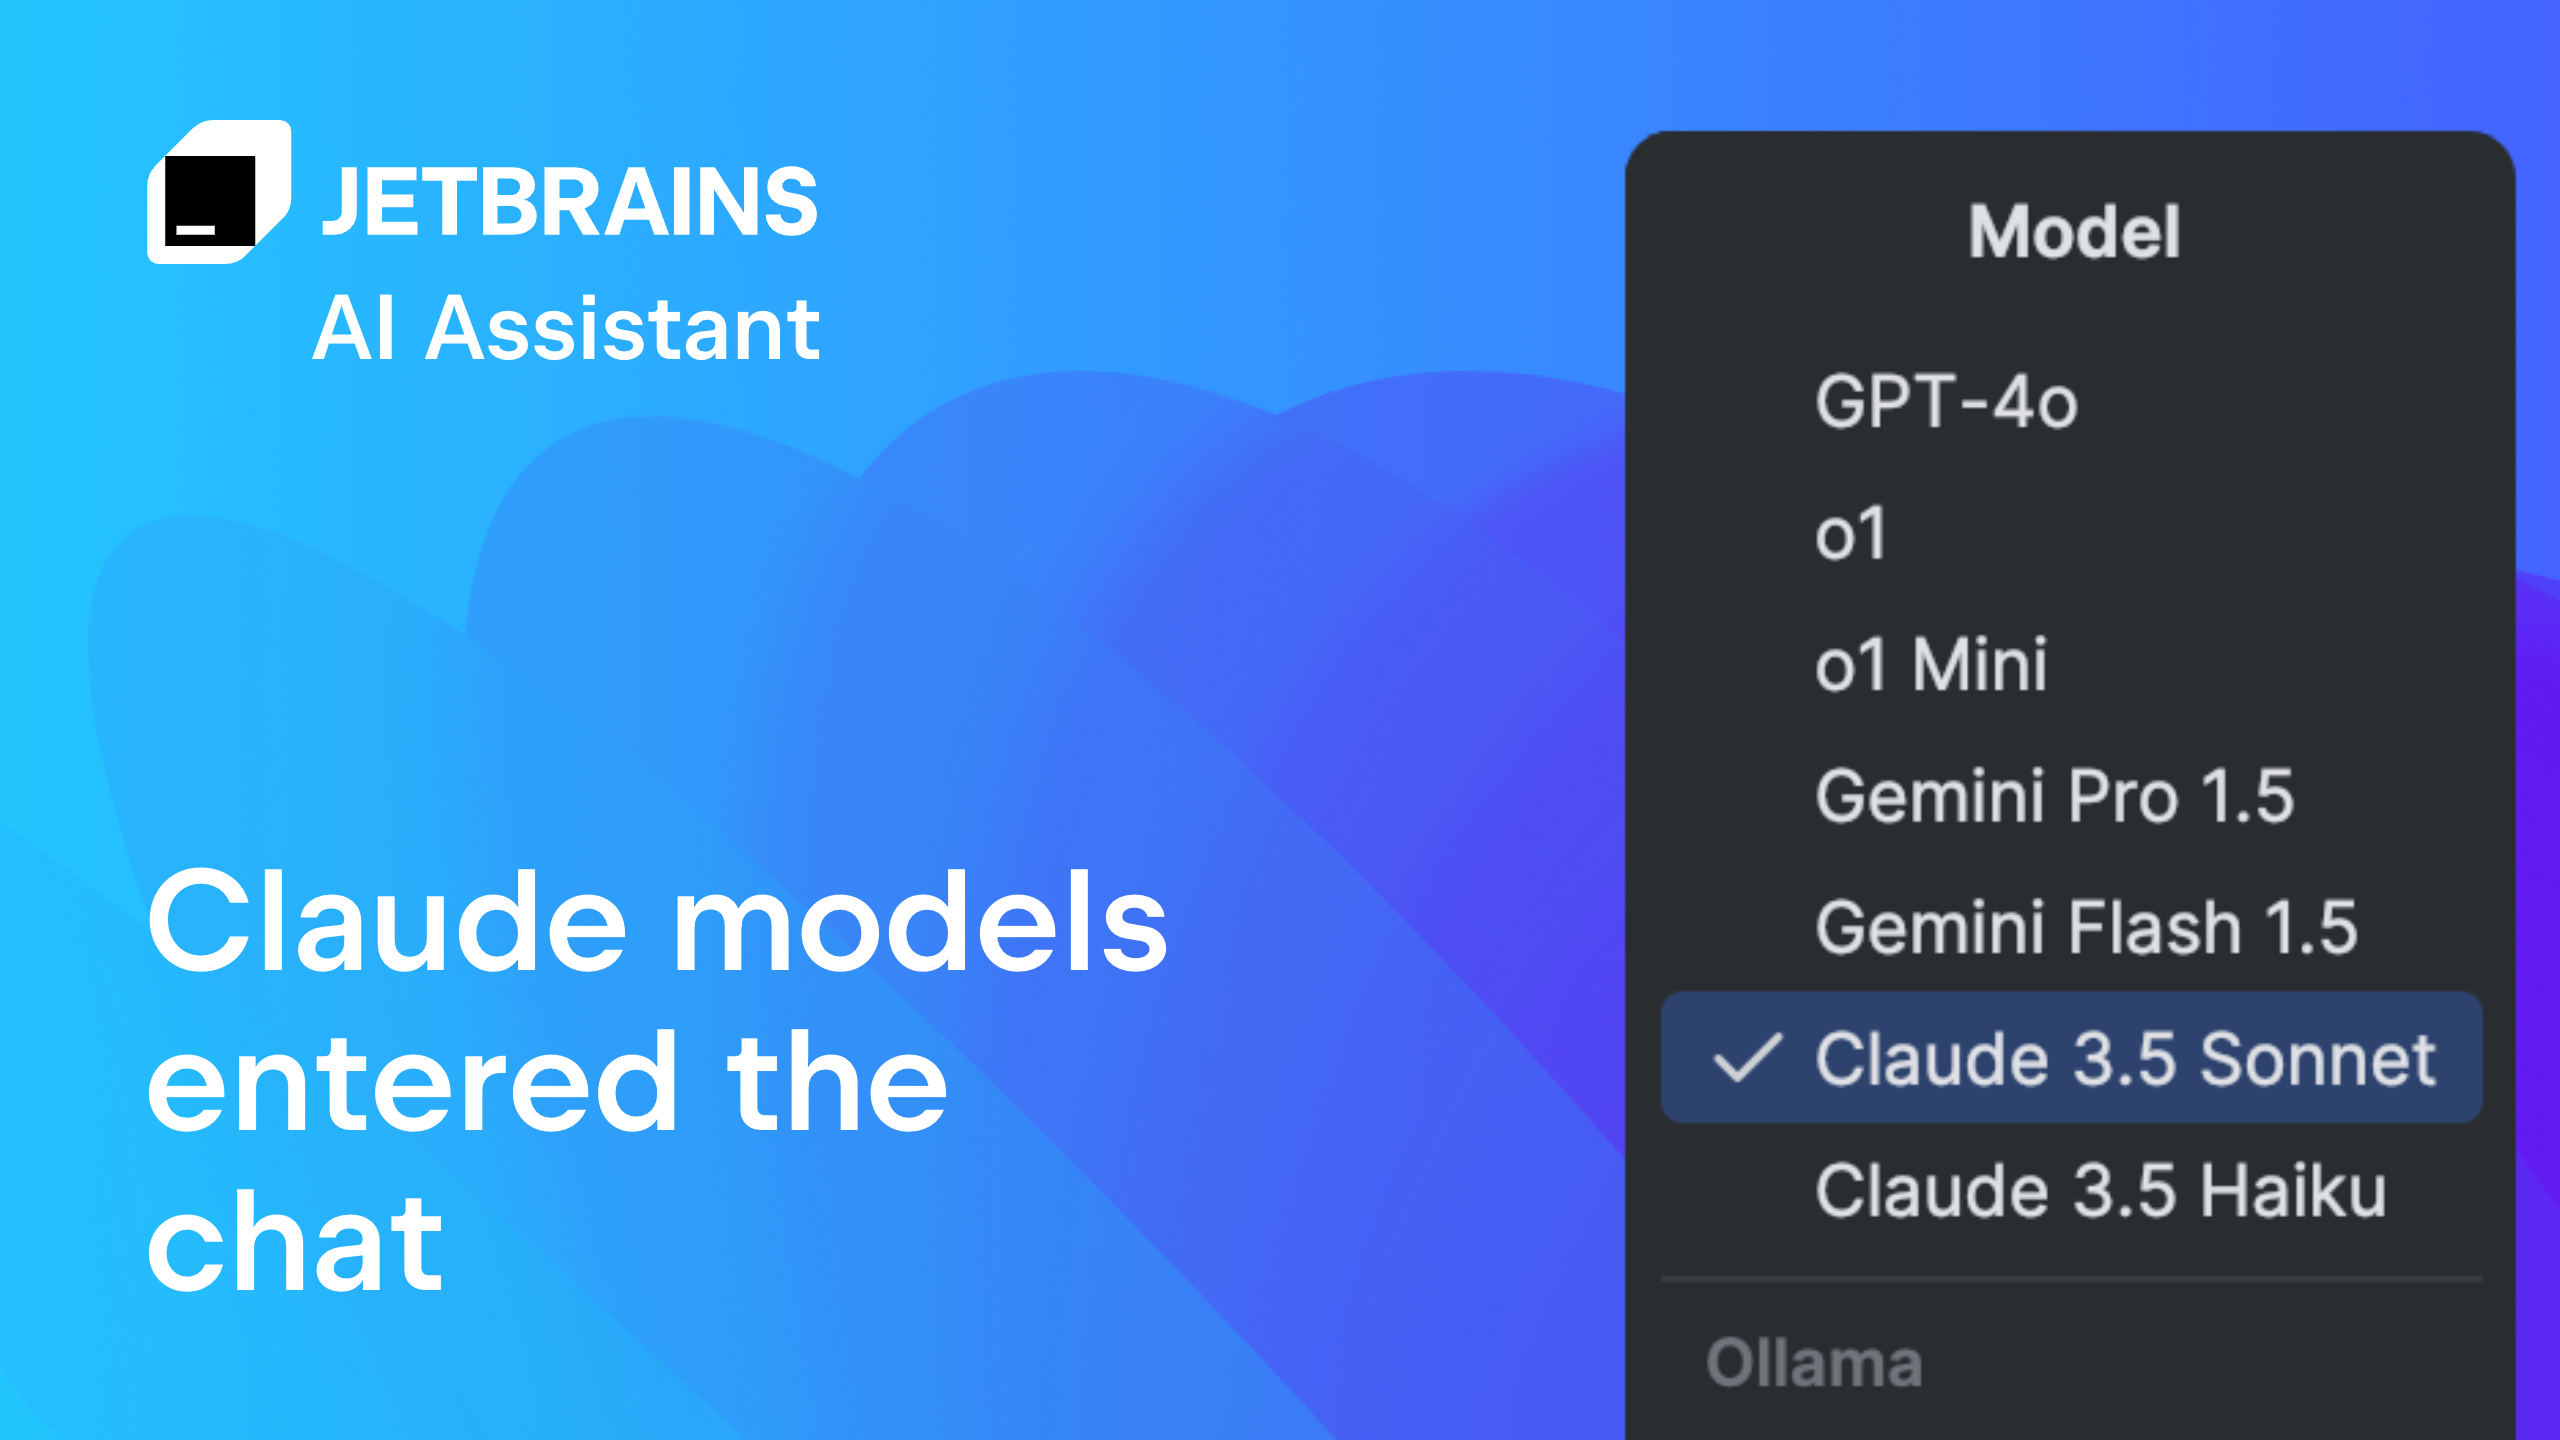
3. JetBrains AI Assistant for IDEs
The JetBrains AI Assistant is deeply embedded within the IDE, offering context-aware suggestions that understand your entire project structure. It helps refactor code, generate unit tests, and explain errors directly within the editor interface. This tight integration minimizes navigation between tools, providing a cohesive environment where AI assistance feels like a natural extension of your existing development workflow and editor capabilities.
4. Sentry for error monitoring
Sentry captures runtime errors and provides detailed stack traces, helping developers pinpoint issues in production environments instantly. Its AI-powered debugging feature, Seer, correlates errors with recent code changes, suggesting likely root causes. This rapid diagnosis capability reduces mean time to resolution, ensuring that critical bugs are addressed before they impact end-users or degrade service reliability across your application infrastructure.
5. Datadog AI for observability
Datadog AI enhances observability by analyzing vast amounts of telemetry data to detect anomalies and predict potential system failures. It provides intelligent insights into application performance, helping teams identify bottlenecks before they become critical issues. This proactive monitoring approach ensures system stability and performance, allowing developers to maintain high availability and deliver a seamless user experience across distributed cloud environments.

Compare AI Debugging Features
Choosing the right debugging tool depends on your specific workflow and the types of bugs you encounter most often. Some developers prioritize deep IDE integration for quick fixes, while others need robust security scanning to catch vulnerabilities before they hit production. This comparison breaks down five leading options based on their core strengths, helping you match the tool to your daily needs.
| Tool | IDE Integration | Security Scanning | Cost Model |
|---|---|---|---|
| Visual Studio Code | Built-in | Extension-based | Free |
| Chrome DevTools | Browser-native | Limited | Free |
| ReSharper | Visual Studio | Code analysis | Paid |
| PyCharm Debugger | JetBrains IDEs | Built-in | Paid |
| Airbrake | Cloud-based | Real-time alerts | Freemium |
If you are building web applications, Chrome DevTools offers immediate, zero-setup visibility into frontend performance and network issues. For larger enterprise projects, tools like ReSharper or PyCharm provide deeper static analysis and automated refactoring, though they come with a subscription cost. Cloud-based monitors like Airbrake are ideal for tracking errors in production environments, offering real-time alerts that help teams react before users notice a problem.

As an Amazon Associate, we may earn from qualifying purchases.
Common Questions About AI Debugging
What are debugging tools? Debugging tools are software programs designed to identify, test, and fix issues within other applications. They provide a systematic way to troubleshoot code by offering detailed insights into program execution, memory usage, and variable states. In the context of AI debugging, these tools often automate the detection of syntax errors and logic flaws, allowing developers to resolve bugs faster than manual inspection.
Is VS Code a debugging tool? Visual Studio Code (VS Code) is a code editor with robust built-in debugging capabilities. It supports debugging for JavaScript, TypeScript, and Node.js out of the box. For other languages, the VS Code Marketplace offers extensions that add specific debugging support, making it a versatile hub for developers who need to switch between different environments without leaving their editor.
Which is the best HTML debugging tool? Chrome DevTools is widely considered the standard for debugging HTML and CSS. It provides a visual interface to inspect the Document Object Model (DOM), modify styles in real-time, and analyze layout issues. While other tools like ReSharper or PyCharm offer advanced features for specific ecosystems, Chrome DevTools remains the go-to choice for web developers needing immediate feedback on HTML structure and styling.

No comments yet. Be the first to share your thoughts!