Quantum code: a new class of bugs
Debugging quantum code presents a fascinating, and frankly daunting, new set of challenges. Unlike classical programming, where errors often manifest as predictable crashes or incorrect outputs, quantum errors are often subtle and probabilistic. The core concepts of quantum mechanics – superposition and entanglement – introduce a level of complexity that traditional debugging methods simply can’t handle.
In classical computing, we deal with bits representing 0 or 1. Quantum computing uses qubits, which can exist in a superposition of both states simultaneously. This means a qubit isn’t definitively 0 or 1 until measured, and that measurement itself influences the system. Entanglement links qubits together, so altering one instantly affects the others, making it difficult to isolate the source of an error.
Furthermore, quantum systems are incredibly sensitive to their environment. Decoherence, the loss of quantum information due to interaction with the outside world, is a constant battle. The probabilistic nature of quantum results means that even a perfectly written program won't always produce the same output. This makes deterministic debugging – stepping through code line by line – less effective. We need new strategies to reason about these kinds of errors.

Common Q# traps
Q#, Microsoft’s quantum programming language, has its own unique set of debugging hurdles. A frequent issue arises from incorrect unitaries – operations that transform quantum states. If a unitary isn't properly defined, it can lead to unintended state manipulation and incorrect results. Another common mistake involves improper resource release; qubits and other quantum resources need to be carefully managed to avoid leaks and performance issues.
The Q# debugger, integrated within Visual Studio and VS Code, provides some level of support. You can set breakpoints, step through code, and inspect the state of qubits. However, it's limited by the inherent challenges of observing a quantum system without disturbing it. Logging and tracing are also valuable techniques. You can use the `Dump` operation to output the state of qubits or other variables during program execution, but remember that dumping too much information can also introduce noise.
Control flow errors – issues with `if` statements, `for` loops, and other control structures – can be particularly tricky in Q#. Because quantum operations are often irreversible, a mistake in control flow can easily lead to an invalid quantum state. One limitation of the current Q# debugging tools is the difficulty in visualizing the evolution of complex quantum states. It’s often necessary to rely on careful code review and simulation to catch these types of errors. The Azure Quantum platform provides tools to help, but debugging remains a significant challenge.
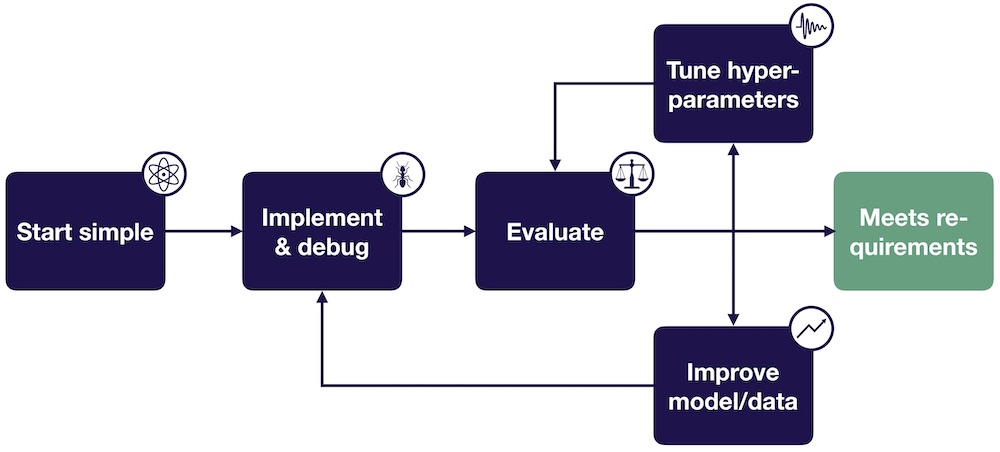
One workaround is to break down complex quantum algorithms into smaller, more manageable pieces. This makes it easier to isolate and debug individual components. Testing individual unitaries and operations thoroughly before combining them into a larger algorithm is also crucial.
Qiskit error mitigation
Qiskit, IBM’s open-source quantum computing framework, offers a range of error mitigation techniques designed to combat the effects of noise and decoherence. Zero-noise extrapolation is a popular method that involves running a quantum circuit multiple times with varying levels of noise and then extrapolating the results to the zero-noise limit. This can provide a more accurate estimate of the ideal output.
Another technique is probabilistic error cancellation (PEC), which attempts to cancel out errors by carefully introducing additional operations. PEC requires characterizing the errors present in the quantum hardware and then designing a cancellation circuit. Dynamical decoupling involves applying a series of carefully timed pulses to qubits to suppress their interaction with the environment, reducing decoherence.
Each of these error mitigation strategies comes with trade-offs. They often require significant computational resources, increasing the runtime of the program. The effectiveness of each technique also depends on the specific characteristics of the quantum hardware and the type of error present. The `qiskit.errors` module provides tools for detecting and handling errors, including custom exception classes and error mitigation algorithms.
Error mitigation has limits. It reduces noise but doesn't remove it. You have to pick the right method based on the specific hardware noise you're seeing.
- Zero-noise extrapolation runs circuits with extra noise to calculate the likely noise-free result.
- Probabilistic Error Cancellation: Introduces operations to cancel out known errors.
- Dynamical Decoupling: Applies pulses to suppress environmental interactions.
Simulators vs. real hardware
A major source of frustration for quantum programmers is the difference in behavior between quantum simulators and real quantum hardware. Simulators, running on classical computers, provide a perfect, noise-free environment. This allows you to test your code and verify its logic without worrying about the effects of decoherence or other hardware imperfections. However, simulators can’t fully replicate the complexities of real quantum systems.
Real quantum hardware is subject to various sources of noise, including qubit imperfections, control errors, and environmental disturbances. These sources of noise can significantly affect the results of a quantum computation. Identifying and isolating hardware-specific errors is a crucial step in debugging quantum code. If your code works perfectly on a simulator but fails on real hardware, the bug is likely related to noise or hardware limitations.
Determining whether a bug lies in your code or the quantum hardware requires careful investigation. Techniques for calibrating and characterizing quantum devices can help identify sources of error. You can also run the same program multiple times and analyze the distribution of results to look for patterns indicative of hardware-specific issues. Comparing results from different quantum devices can also provide valuable insights.
New debugging frameworks
Recent research, detailed in the paper “[2412.12269] A Framework for Debugging Quantum Programs,” proposes a new framework specifically designed to address the unique challenges of quantum debugging. The authors recognize that traditional debugging methods are inadequate for quantum systems and advocate for a more holistic approach.
This framework focuses on three key components: state reconstruction, error localization, and error characterization. State reconstruction aims to accurately determine the quantum state of the system at various points during program execution. Error localization attempts to identify the specific qubits or operations that are contributing to errors. Error characterization seeks to understand the nature and magnitude of the errors.
The framework proposes using a combination of techniques, including quantum state tomography, randomized benchmarking, and machine learning, to achieve these goals. One potential benefit of this framework is its ability to provide more detailed and actionable insights into the causes of quantum errors. Compared to existing debugging methods, it promises a more systematic and comprehensive approach. However, it’s still early days, and the practical implementation of this framework presents significant challenges.
- State reconstruction determines the quantum state during execution.
- Error Localization: Identify qubits/operations contributing to errors.
- Error Characterization: Understand the nature and magnitude of errors.
Quantum Debugging Approach Comparison (2026)
| Debugging Method | Ease of Use | Error Type Effectiveness | Computational Overhead | Hardware Compatibility |
|---|---|---|---|---|
| Q# Debugger | Generally high for Q# developers 🧑💻 | Strong for logical errors, control flow issues, and state inspection. Less effective for hardware-specific errors. | Moderate - introduces some runtime overhead during debugging sessions. | Primarily designed for Q# and Azure Quantum compatible hardware. |
| Qiskit Error Mitigation Techniques | Requires familiarity with quantum error correction concepts 📚 | Effective against common noise sources (bit-flip, phase-flip). Performance varies based on the chosen mitigation strategy. | Can be significant, depending on the complexity of the mitigation technique. Some methods require substantial auxiliary qubits. | Broad hardware compatibility, as Qiskit supports a wide range of quantum backends. |
| Framework from [2412.12269] | Potentially complex initial setup, but aims for automated error localization. | Designed to identify discrepancies between expected and observed program behavior, useful for a variety of error types. | Variable – depends on the specific debugging strategy employed within the framework. The paper investigates trade-offs. | Intended to be hardware-agnostic, but performance may be influenced by hardware characteristics. |
| State Tomography (as a debugging aid) | Requires significant expertise and data collection 🔬 | Powerful for identifying state errors and characterizing noise, but computationally expensive. | Very High – requires numerous measurements and complex data analysis. | Compatible with most quantum hardware, but practical limitations exist for large qubit systems. |
| Simulation-Based Debugging | Relatively easy to set up and use for smaller circuits. | Effective for identifying logical errors, but may not accurately reflect real hardware noise. | Moderate – simulation complexity increases rapidly with qubit count. | Not hardware-specific; useful for initial development and testing. |
| Pulse-Level Debugging (where available) | Highly specialized; requires deep understanding of quantum hardware ⚙️ | Most effective for diagnosing hardware-related errors and calibrating quantum gates. | High – requires precise control and measurement of quantum signals. | Limited to hardware platforms that expose pulse-level control. |
Illustrative comparison based on the article research brief. Verify current pricing, limits, and product details in the official docs before relying on it.
What's next for quantum debugging
The field of quantum debugging is still in its infancy, and many challenges remain unsolved. Emerging trends suggest that AI and machine learning will play an increasingly important role in automating error detection and correction. Machine learning algorithms can be trained to identify patterns indicative of errors and to predict the behavior of quantum systems under different conditions.
We’re also seeing the development of new tools and techniques for quantum state tomography and process tomography, which can provide more detailed information about the state of a quantum system. These tools will enable us to better understand the sources of error and to develop more effective error mitigation strategies. The Microsoft Learn documentation for Azure Quantum highlights ongoing work in debugging and testing quantum programs, anticipating growth in 2026.
We need better visualization tools as qubit counts grow. Integrating these tools directly into compilers will help bridge the gap between writing code and seeing how it actually runs on a chip.

No comments yet. Be the first to share your thoughts!