
Why AI debugging tools matter now
The shift from manual debugging to AI-assisted workflows is no longer a trend; it is a necessity for modern development teams. Traditional debugging relies on developers manually stepping through code, inspecting variables, and setting breakpoints—a process that is both time-consuming and prone to human error. AI debugging tools automate these repetitive tasks, identifying patterns and anomalies that humans might miss during a standard code review.
These tools accelerate bug tracking by integrating directly into your development environment. Instead of waiting for a bug report from a user, AI agents can proactively analyze code changes, predict potential failures, and suggest fixes before the code even reaches production. This proactive approach significantly reduces the mean time to resolution, allowing teams to focus on building features rather than fixing broken ones.
AI debugging tools reduce mean time to resolution by automating repetitive code review tasks and identifying patterns humans miss.
While traditional tools like Visual Studio Code and Chrome DevTools remain essential for runtime analysis, they require significant manual effort. AI-powered solutions such as Graphite Agent, ChatDBG, and Workik offer a layer of intelligence that streamlines the entire debugging lifecycle. By leveraging these tools, developers can catch errors earlier in the development cycle, leading to more stable software and faster release cycles.
For teams looking to integrate these powerful tools into their workflow, here are some of the top-rated AI debugging assistants available for purchase.
5 AI Debugging Tools for Automated Code Review and Bug Tracking
Automating code review and bug tracking reduces manual overhead while catching critical errors early in the development cycle. The following five AI debugging tools streamline these workflows by integrating seamlessly into existing CI/CD pipelines to provide actionable, context-aware insights.
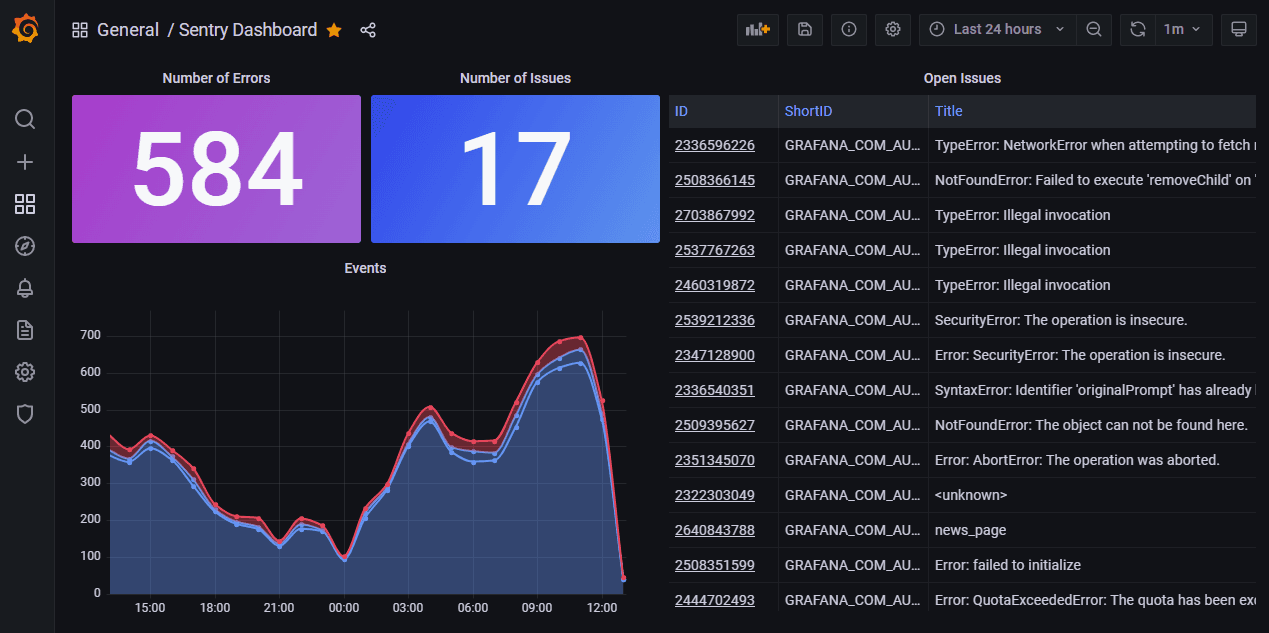
1. Sentry AI for Real-Time Error Monitoring
Sentry’s AI Debugger transforms raw stack traces into actionable insights, pinpointing exact code lines causing crashes in production. This real-time monitoring reduces time to resolution by providing context-aware suggestions directly within your workflow. It acts as an early warning system, catching issues before they impact users. The tool integrates seamlessly with major frameworks, ensuring comprehensive coverage for modern web applications.
2. GitLab Duo Code Suggestions and Review
GitLab Duo embeds AI directly into the merge request workflow, offering inline code suggestions and automated review comments. It identifies potential logic errors and security vulnerabilities during the review phase, preventing bugs from reaching production. This tool streamlines collaboration by highlighting risky code sections and suggesting improvements, making code reviews faster and more thorough. It supports multiple languages and integrates with existing CI/CD pipelines.
3. GitHub Copilot Enterprise Code Analysis
GitHub Copilot Enterprise extends AI assistance to the entire codebase, analyzing patterns across repositories to detect inconsistencies and potential bugs. It provides organization-wide insights, helping teams maintain code quality standards and identify technical debt. This tool goes beyond individual snippets, offering a holistic view of code health and suggesting refactoring opportunities. It enhances developer productivity by automating routine code checks and promoting best practices.

4. SonarQube AI-Powered Code Quality Checks
SonarQube leverages AI to perform static code analysis, detecting bugs, vulnerabilities, and code smells across your project. It provides detailed reports and actionable recommendations, helping developers fix issues before deployment. This tool supports continuous inspection, ensuring code quality remains high throughout the development lifecycle. It integrates with popular IDEs and CI/CD tools, making it easy to incorporate into existing workflows.
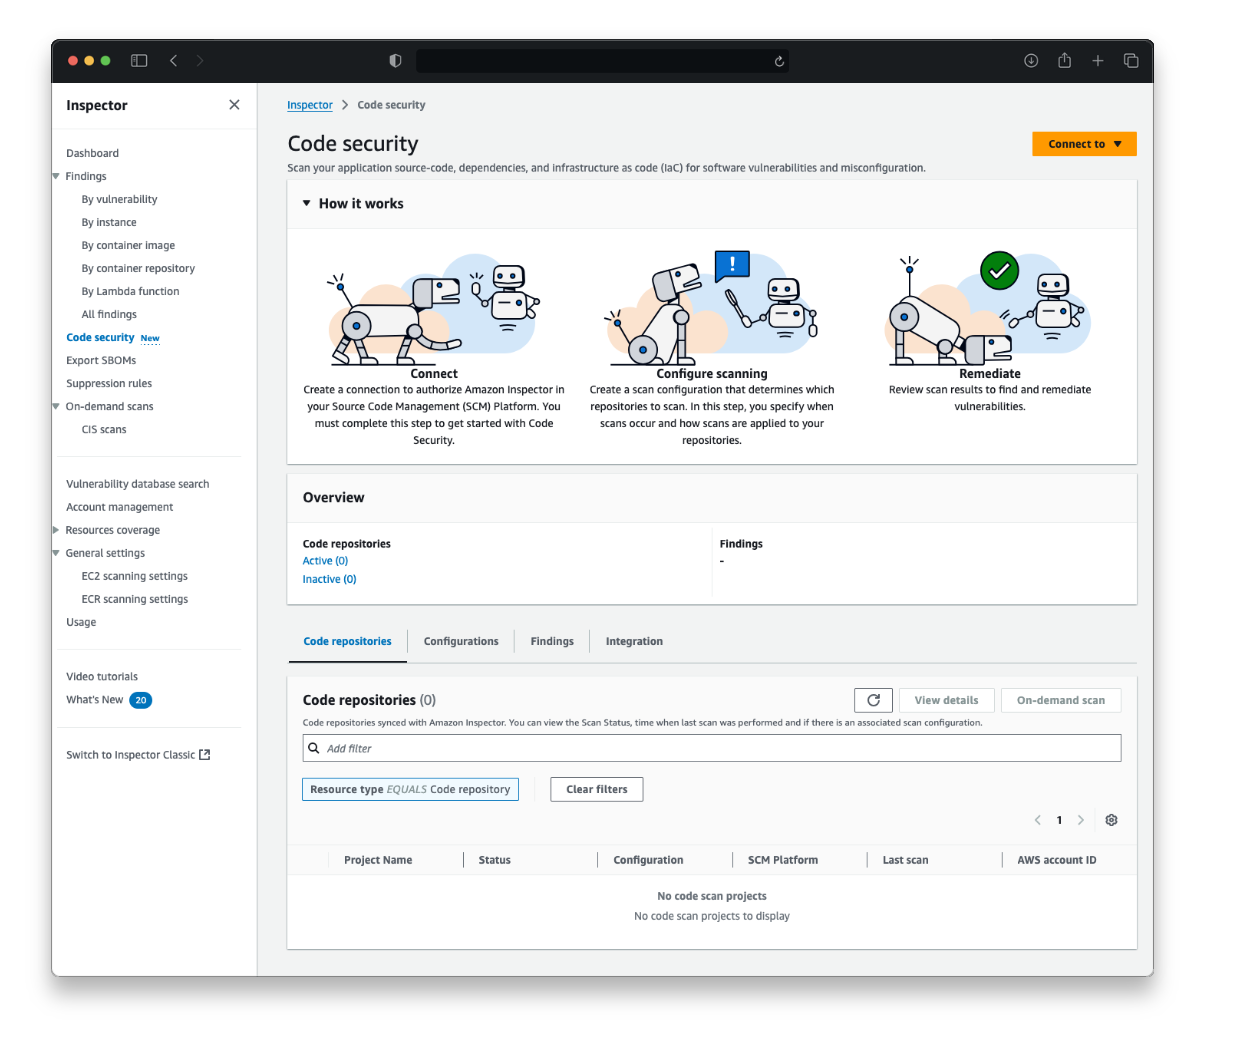
5. DeepCode AI Automated Vulnerability Detection
DeepCode AI uses machine learning to analyze code and identify security vulnerabilities and logical errors. It scans codebases for known patterns of weakness, providing precise locations and explanations for each finding. This tool helps developers address security risks early in the development process, reducing the likelihood of breaches. It supports multiple programming languages and integrates with various development environments for seamless adoption.
How to choose the right debugging tool
Selecting the right AI debugging tool requires matching specific capabilities to your team’s tech stack and workflow. While traditional debuggers like Visual Studio Code or Chrome DevTools remain essential for runtime analysis, AI-powered solutions offer distinct advantages in automated code review and proactive bug tracking. Graphite Agent excels at integrating directly into pull requests to catch logic errors before they merge, while ChatDBG provides interactive, conversational assistance for complex runtime issues. Workik bridges the gap by delivering comprehensive error tracking alongside automated suggestions, making it a strong candidate for teams managing large, distributed codebases.
When evaluating options, prioritize tools that integrate seamlessly with your existing CI/CD pipeline. The best debugging tool is not necessarily the one with the most features, but the one that reduces friction in your daily workflow. Look for solutions that support your primary languages—whether that is JavaScript, Python, or embedded C++—and offer scalable licensing for growing teams. Avoid tools that require extensive manual configuration; modern AI debugging should feel like a natural extension of your IDE, not a separate platform you must constantly monitor.
| Tool | Primary Focus | Best For |
|---|---|---|
| Graphite Agent | Code Review | Pre-merge AI analysis |
| ChatDBG | Interactive Debugging | Complex runtime issues |
| Workik | Error Tracking | Automated error resolution |
Integrating AI debugging into your workflow
Adopting an AI debugging tool requires more than just installing a plugin; it demands a shift in how your team interacts with code. The goal is to embed automated bug tracking and code review directly into your existing CI/CD pipelines, ensuring that issues are caught before they reach production. Start by configuring the tool to scan your primary repositories, setting thresholds for severity to avoid alert fatigue. For instance, Graphite Agent excels at automated code review, while ChatDBG provides interactive assistance for runtime issues, allowing developers to resolve errors without leaving their IDE.
Team training is equally critical. Developers should understand that these tools act as assistants, not replacements for human judgment. Establish clear guidelines on when to trust AI suggestions versus when to perform manual verification. This approach ensures that the AI debugging workflow enhances productivity without introducing new risks. By focusing on concrete products like Workik for error tracking or Visual Studio Debugger for runtime analysis, you can build a robust system that scales with your team's needs.
To help you choose the right solution for your specific stack, here is a comparison of leading AI debugging tools:
| Tool | Primary Focus | Best Integration |
|---|---|---|
| Graphite Agent | Automated Code Review | GitHub / GitLab |
| ChatDBG | Interactive Debugging | VS Code / JetBrains |
| Workik | Error Tracking | CI/CD Pipelines |
| Visual Studio Debugger | Runtime Analysis | Visual Studio |
For those looking to purchase hardware or software bundles that support these workflows, here are some recommended products:


As an Amazon Associate, we may earn from qualifying purchases.
Frequently asked questions about AI debugging tools
What is the best debugging tool for automated code review? For AI-powered solutions, Graphite Agent offers excellent automated code review capabilities, while ChatDBG provides interactive debugging assistance during runtime. Workik is another strong option for comprehensive error tracking and bug identification across your codebase.
Is VS Code considered an AI debugging tool? Visual Studio Code is a code editor with robust built-in debugging support for JavaScript, TypeScript, and Node.js. While it isn't an AI tool itself, its marketplace hosts numerous extensions that integrate AI features for code review and automated bug detection.
What are the four core debugging techniques? Effective debugging relies on four main techniques: step-by-step execution to isolate failures, conditional breakpoints to pause code only when specific conditions are met, inspecting variables to check stored values, and using the debug console for instant feedback on running code.

No comments yet. Be the first to share your thoughts!