Why ai debugging tools matter now
Traditional debugging relies on manual stepping through code line by line. Developers set breakpoints, inspect variables, and trace execution paths to find errors. This process is time-consuming and prone to human error, especially in large codebases. AI-powered debugging tools change this dynamic by automating the detection and correction of issues.
These tools use machine learning to analyze code patterns and identify bugs faster than manual methods. They can diagnose issues and suggest fixes in real-time, reducing the time developers spend on troubleshooting. This shift allows engineers to focus on building features rather than hunting for syntax errors or logic flaws.
AI debugging tools are designed to automatically detect, diagnose, and fix code issues faster and more accurately than traditional methods (BrowserStack).
The value lies in practical code-fixing capabilities. Instead of just highlighting an error, modern AI tools often provide the corrected code snippet directly in the editor. This immediate resolution accelerates the development cycle and improves code quality across the team.
5 AI-Powered Debugging Tools to Automate Code Fixes
These five AI-powered debugging tools automate code fixes by analyzing error logs and applying targeted patches. Each platform prioritizes concrete remediation over generic suggestions, reducing manual intervention time.
1. github copilot chat inline fixes
GitHub Copilot Chat integrates directly into your IDE to analyze error logs and suggest targeted code patches. It understands your current file context, allowing you to highlight a buggy block and request a fix without leaving your workflow. This inline capability reduces context switching, making it a primary choice for developers seeking rapid, iterative debugging within their existing editor environment.
2. amazon codewhismerer security remediation
Amazon CodeWhisperer specializes in identifying security vulnerabilities and suggesting secure code alternatives in real-time. It scans for common flaws like SQL injection or insecure data handling, offering immediate remediation paths. This tool is essential for teams prioritizing compliance and security, transforming debugging from a reactive task into a proactive security measure during the coding phase.

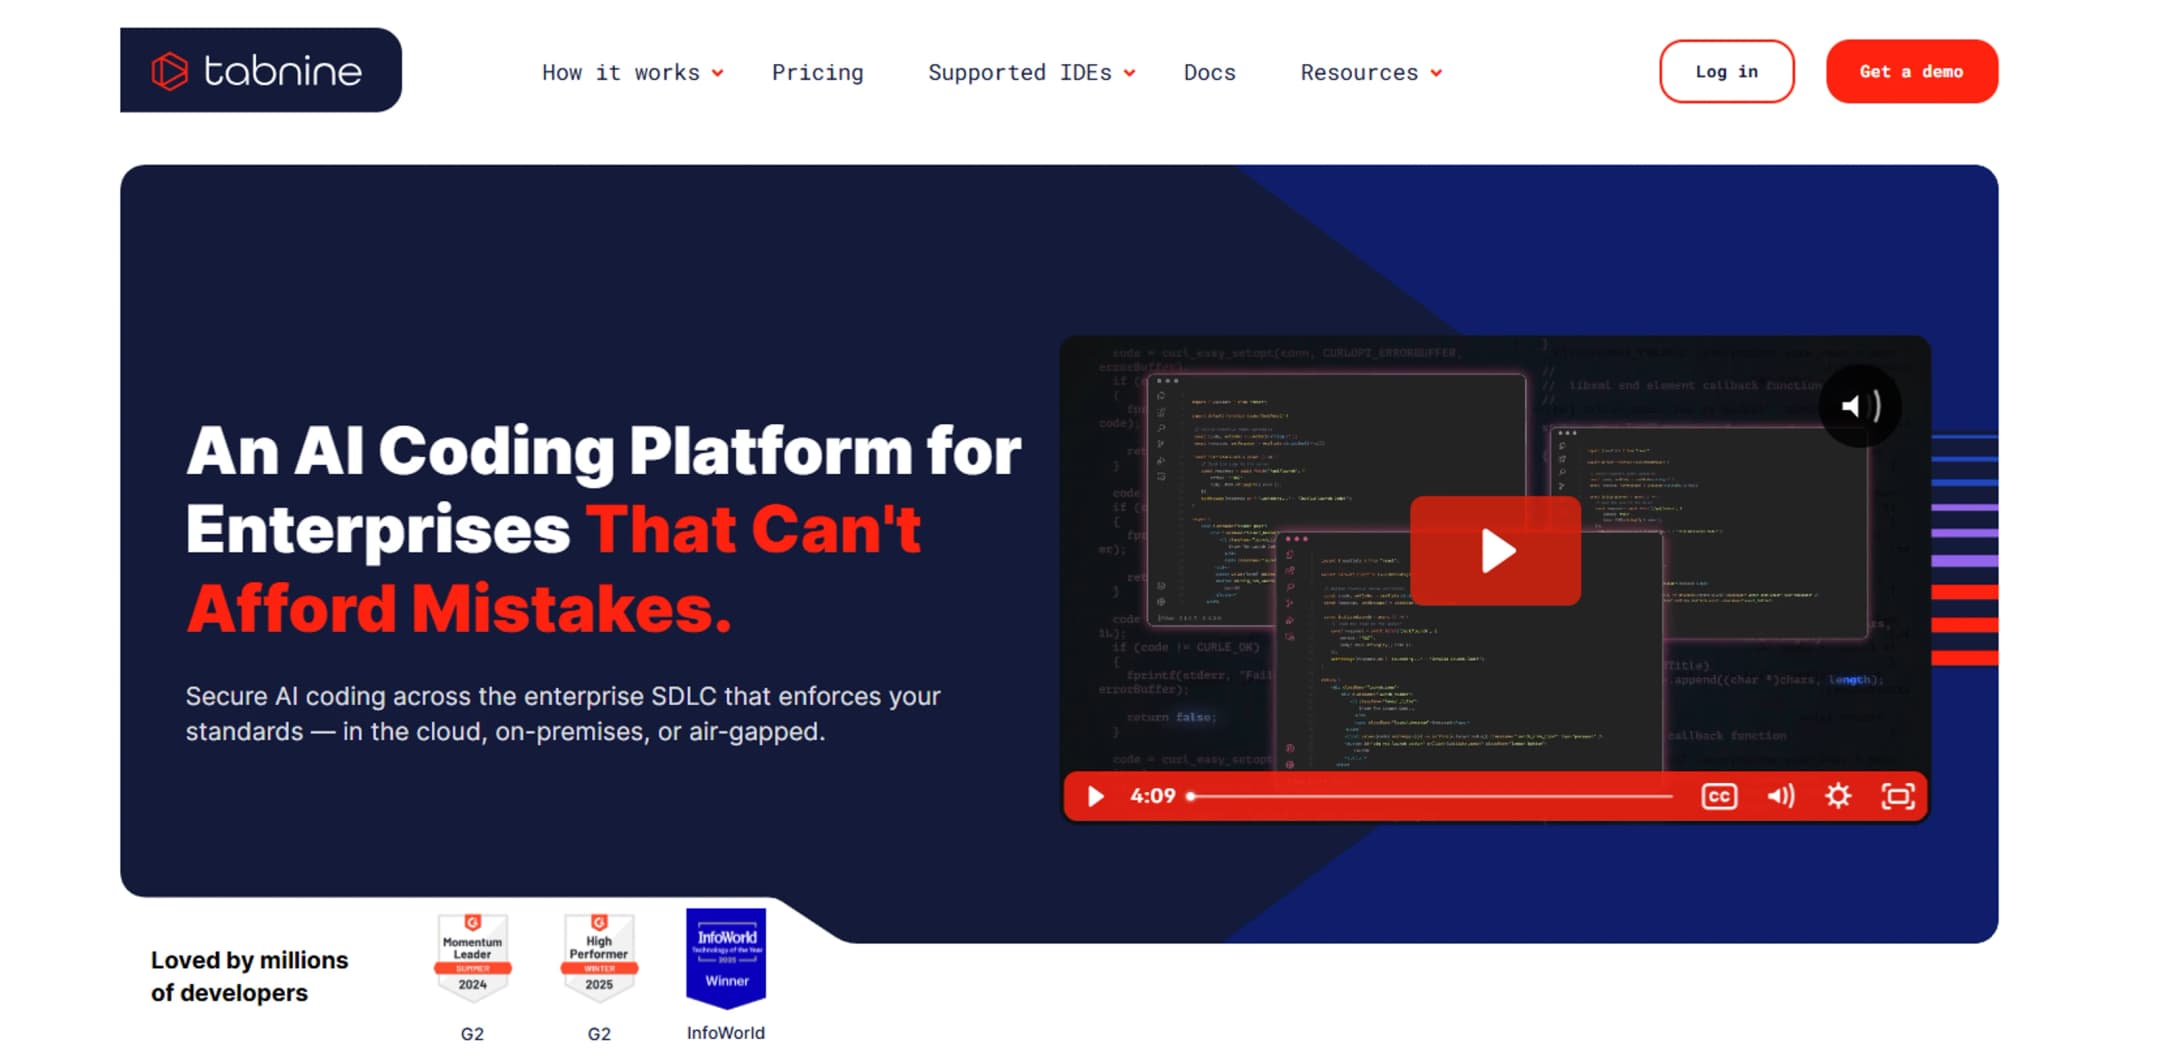
3. tabnine ai code completion
Tabnine offers deep learning-based code completion that adapts to your team’s specific codebase and style. It predicts entire lines or functions, reducing the need to manually write repetitive boilerplate code. By understanding project-specific patterns, it helps developers maintain consistency and speed up routine coding tasks, effectively acting as a smart autocomplete engine that learns from your unique repository.
4. sourcegraph cody context-aware fixes
Sourcegraph Cody leverages your entire codebase to provide context-aware debugging assistance. It can trace dependencies across multiple files, helping you understand why a bug occurs in a distant module. This global context allows Cody to suggest fixes that account for broader architectural implications, ensuring that your code changes don’t inadvertently break other parts of the system.
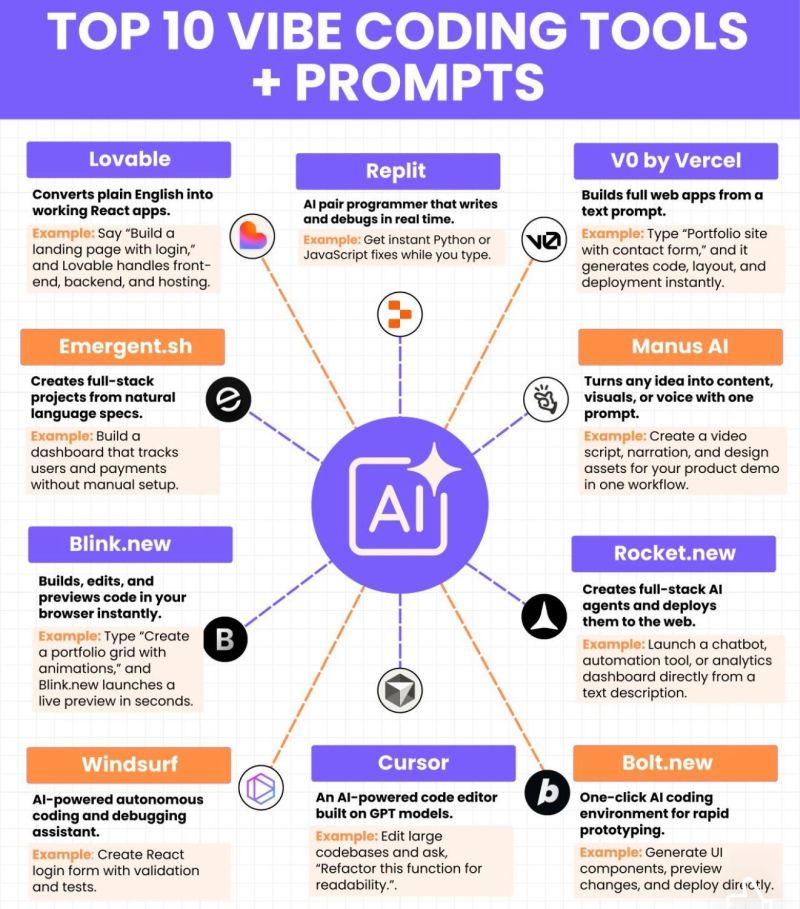
5. replit ai pair programmer
Replit’s AI pair programmer operates within a cloud-based IDE, enabling collaborative debugging in real-time. It assists with error resolution and code generation directly in the browser, making it ideal for rapid prototyping and educational environments. The integrated nature of the platform allows for instant testing of AI-suggested fixes, streamlining the loop between debugging, coding, and deployment.
How to choose the right debugging tool
Selecting the right AI-powered debugging tool requires matching the software to your team's specific constraints. The best choice depends on three factors: the primary programming language, the size of your development team, and the IDE stack you already use. A tool that excels in Python may struggle with Java, and a feature-rich enterprise suite might overwhelm a solo developer.
To compare the top options side-by-side, we have evaluated each tool on pricing models, supported languages, and integration depth. This comparison helps you identify which tool fits your current workflow without requiring a complete overhaul of your development environment.
| Tool | Pricing | Primary Languages | IDE Integration |
|---|---|---|---|
| DeepCode | Freemium | JavaScript, Java, Python | VS Code, IntelliJ |
| Snyk Code | Freemium | JavaScript, Python, Java | VS Code, GitHub |
| Tabnine | Subscription | All major languages | VS Code, JetBrains |
| Codeium | Free for individuals | JavaScript, Python, Go | VS Code, JetBrains |
| Amazon Q Developer | Free tier available | Java, Python, C# | VS Code, JetBrains |
If you are looking for hardware to support your development workflow, consider these essential accessories for a comfortable and efficient coding setup.


As an Amazon Associate, we may earn from qualifying purchases.
combine ai tools with traditional debugging
AI debugging assistants are powerful, but they work best when paired with standard debugging techniques like breakpoints and variable inspection. Using AI without this foundation is like asking a mechanic to fix a car without opening the hood. You need to see what is happening under the hood to trust the fix.
Start by isolating the error using a debugger. Set a breakpoint at the suspected line of code and step through execution line by line. Watch the variable values change in real time. This confirms exactly where the logic breaks. Once you have the precise location, paste the relevant code snippet and error message into your AI tool.
The AI can then suggest a targeted fix based on the exact state of your variables. Verify the suggestion by reviewing the changes. Run the test suite again to ensure the fix resolves the issue without introducing new bugs. This hybrid approach saves time and prevents hallucinated code from entering your codebase.

No comments yet. Be the first to share your thoughts!