Quantum code: a new kind of bug
Debugging has always been a core skill for programmers. But quantum computing introduces a whole new level of difficulty. It’s not simply a matter of tracking down syntax errors or logic flaws; the very nature of quantum mechanics throws up obstacles traditional methods can’t handle. Things like superposition – where a qubit can be in multiple states at once – and entanglement – where qubits become linked – mean that observing the system changes the system.
This isn't like debugging a classical program where you can reliably step through code and inspect variables. Quantum results are probabilistic. You run the same program multiple times and get slightly different outcomes. This inherent uncertainty makes pinpointing the source of an error incredibly challenging. It’s a bit like trying to diagnose a problem in a system where the symptoms change every time you look at it.
The stakes are also different. A bug in a web application might cause frustration, but a bug in quantum code could lead to incorrect scientific results, flawed financial models, or compromised security. We are dealing with potentially groundbreaking calculations, and the margin for error is small. This makes developing robust quantum debugging skills not just a technical necessity, but a critical one.
I think a lot of developers coming from classical backgrounds underestimate just how different this is. It's not just a new language or a new paradigm; it's a fundamentally different way of thinking about computation and error.
Azure quantum debugging tools
Microsoft’s Azure Quantum platform provides a suite of tools designed to help developers debug their quantum programs. The core of this toolkit is the debugger itself, which allows you to step through your Q# code (the primary language for Azure Quantum) and inspect the state of your qubits at each step. This is a major step up from simply running a program and hoping for the best.
Setting breakpoints is crucial. You can pause execution at specific lines of code to examine the values of variables and the state of the quantum register. Azure Quantum also lets you watch variables, so you can track their values as the program runs. This is particularly useful for identifying when and where unexpected changes occur. Analyzing execution traces is another powerful feature, allowing you to see the entire sequence of operations that led to a particular result.
A step-by-step guide to debugging in Azure Quantum usually begins with writing a small, isolated quantum program that exhibits the bug. Then, you’ll use the Azure Quantum Development Kit (QDK) to compile and run the program in the debugger. The debugger provides a visual representation of the quantum circuit, making it easier to understand the flow of operations.
The platform also offers features for visualizing qubit states, which can help you identify errors that might not be immediately apparent from the code. You can see the probabilities of measuring different states, and identify any deviations from the expected behavior. It's a sophisticated system, but it requires a good understanding of Q# and quantum concepts to use effectively. The Microsoft Learn documentation provides a solid foundation for getting started.
Common Quantum Error Types
- Bit-Flip - A qubit’s 0 and 1 states are swapped. Think of it like a classical bit being accidentally flipped from 0 to 1, or vice-versa.
- Phase-Flip - The relative phase between the 0 and 1 components of a qubit is flipped. This affects interference patterns in quantum computations.
- Amplitude Damping - Represents the loss of quantum information due to interaction with the environment. Essentially, the probability amplitude of a qubit in the |1⟩ state decreases over time.
- Depolarization - A qubit is randomly transformed into one of the basis states (0, 1, +1, -1) with equal probability, effectively destroying the quantum information.
- Gate Errors - Imperfections in the quantum gates themselves, causing them to not perform the intended operation perfectly. These can manifest as inaccuracies in the gate’s rotation angle or unintended state transitions.
- Decoherence - The loss of quantum properties (superposition and entanglement) due to interaction with the environment. This is a major challenge in building stable quantum computers.
- Relaxation - A qubit spontaneously transitions from an excited state to its ground state, releasing energy into the environment. Similar to amplitude damping, but specifically describes a transition *from* |1⟩ *to* |0⟩.
Simulators vs. real hardware
When debugging quantum code, you have a choice: use a quantum simulator or run it on actual quantum hardware. Simulators offer a controlled environment where you can easily inspect qubit states and step through code. They’re ideal for initial development and for isolating bugs. However, simulators don’t perfectly replicate the behavior of real qubits.
Real quantum hardware introduces additional sources of error, such as noise and decoherence, that are difficult to simulate accurately. Running your code on real hardware can reveal bugs that wouldn’t surface in a simulator. It’s the ultimate test of your program’s robustness. But it’s also slower and more expensive.
The trade-off is significant. Simulators are great for finding logical errors and understanding the basic behavior of your algorithm. Real hardware is essential for validating your algorithm’s performance in the face of real-world noise. I often recommend starting with a simulator, then moving to real hardware once you’ve ironed out the major bugs.
The fidelity of simulators is constantly improving, but they will likely always be an approximation. The key is to understand the limitations of each approach and choose the right tool for the job.
Writing code that's easy to fix
Preventing bugs is always better than fixing them. When it comes to quantum code, this is especially true. Writing clear, well-structured code can significantly reduce the likelihood of errors. Use descriptive variable names that clearly indicate the purpose of each qubit and register. Avoid overly complex expressions and break down large algorithms into smaller, more manageable functions.
Adding comments is essential. Explain the purpose of each section of code and any assumptions you’re making. This will make it easier for you – and others – to understand your code and identify potential problems. Modularity is also key. Design your code so that different components can be tested independently.
Error mitigation techniques can help reduce the impact of errors. These techniques involve running the same program multiple times and averaging the results, or using error-correcting codes to detect and correct errors. Fault tolerance is the ultimate goal, but it’s still a long way off. For now, error mitigation is the best we can do.
Testability is often overlooked in quantum programming. Writing unit tests for your quantum algorithms can help catch bugs early on. While it’s challenging to test quantum code directly, you can test the classical components that interface with the quantum computer.
Simulators vs. Real Quantum Hardware: A Comparison for Debugging
| Accuracy | Speed | Cost | Debugging Difficulty | Scalability |
|---|---|---|---|---|
| Simulator | High | Fast | Low | Easily Scalable |
| Real Hardware | Lower | Slower | High | Challenging |
| Simulator | Deterministic | Very Fast | Minimal | Straightforward |
| Real Hardware | Probabilistic | Variable | Significant | Complex |
| Simulator | Idealized conditions | Near Instant | Free - Moderate | Good for initial testing |
| Real Hardware | Real-world conditions | Potentially Slow | Very Expensive | Essential for validation |
Qualitative comparison based on the article research brief. Confirm current product details in the official docs before making implementation choices.
Community Insights: Debugging in the Wild
Jade Awesome Fisher, in a Medium article from August 2025, highlights a common challenge for newcomers to quantum debugging: the unstable nature of quantum data. The inherent uncertainty makes traditional debugging approaches less effective. Developers often find themselves relying on statistical analysis and repeated measurements to identify errors.
A recurring theme in online forums is the difficulty of tracking down errors caused by subtle interactions between qubits. Entanglement can create complex dependencies that are hard to untangle. Many developers report spending hours debugging a single line of code, only to discover that the problem lies elsewhere.
A common mistake is trusting simulators too much. A program that runs perfectly in a virtual environment often fails on real hardware. Simulators are just approximations; they don't capture the messy physics of a real processor.
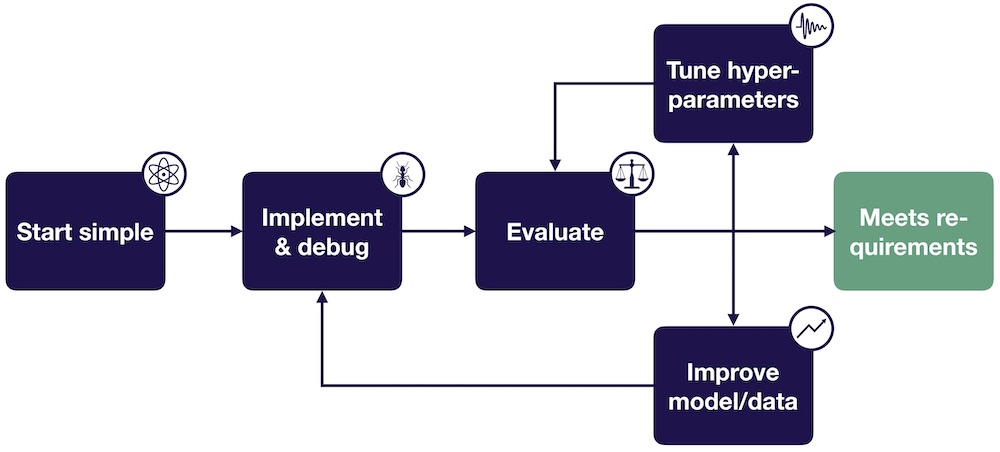
Successful debugging strategies often involve a combination of careful code review, thorough testing, and a deep understanding of quantum mechanics. Experienced developers emphasize the importance of starting with a simple program and gradually adding complexity. They also recommend using visualization tools to gain insights into the behavior of qubits.
Automated detection and verification
The field of quantum debugging is still in its early stages, and new tools and techniques are constantly emerging. Automated error detection is one promising area of research. The goal is to develop algorithms that can automatically identify and diagnose errors in quantum code. This would significantly reduce the burden on developers and speed up the debugging process.
Self-healing quantum programs are another exciting possibility. These programs would be able to detect and correct errors on the fly, without human intervention. This would require a deeper understanding of quantum error correction and the development of more robust error-correcting codes.
I’m also seeing increased interest in formal verification methods. These methods involve using mathematical techniques to prove that a quantum program meets its specifications. While formal verification is computationally expensive, it can provide a high degree of confidence in the correctness of a program.
As quantum computers become more powerful and complex, debugging will become even more challenging. The tools and techniques we use today may not be sufficient to handle the scale and complexity of future quantum systems. But I am optimistic that continued research and innovation will lead to breakthroughs in quantum debugging.
Essential Books for Debugging Quantum Computing Code

Comprehensive coverage of quantum computation and information theory · Includes updates and new material reflecting recent advancements · Serves as a foundational text for researchers and students
This classic text provides the deep theoretical understanding necessary to grasp the complexities of quantum algorithms and identify potential errors in your code.

Bridging the gap between computer science and quantum mechanics · Focuses on algorithms and computational aspects · Suitable for those with a computer science background
Designed for computer scientists, this book translates quantum concepts into familiar computational terms, making it easier to debug by relating quantum operations to classical logic.
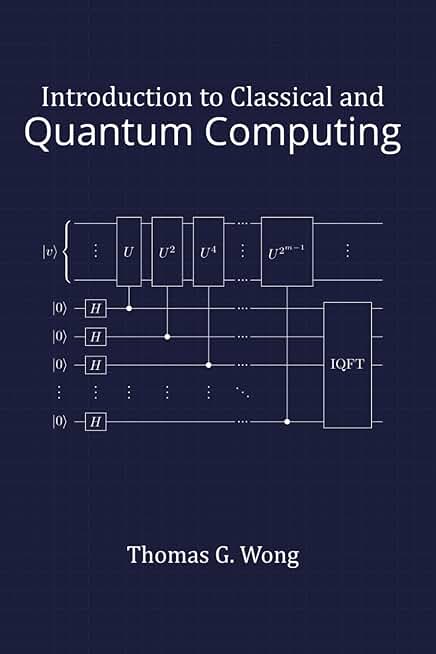
Accessible introduction to both classical and quantum computing principles · Covers fundamental concepts and basic algorithms · Ideal for beginners entering the field
This affordable guide offers a gentle introduction to the core ideas of both classical and quantum computing, helping you build a solid foundation for debugging.

Practical approach to programming quantum computers · Includes numerous code examples and algorithms · Focuses on hands-on implementation
With its focus on practical code samples and essential algorithms, this book is invaluable for debugging by providing concrete examples of how quantum programs should work.
As an Amazon Associate I earn from qualifying purchases. Prices may vary.


No comments yet. Be the first to share your thoughts!