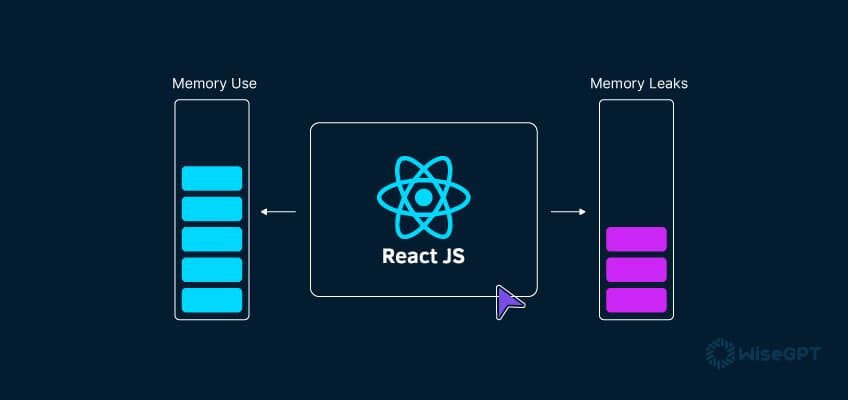
How memory leaks work in React
A memory leak happens when your code keeps a reference to an object that isn't needed anymore. While JavaScript has a garbage collector to reclaim memory, it can't free up objects that are still reachable through active references. In React, this usually means a component stays in memory after it should have been destroyed.
The garbage collector operates by identifying objects that are no longer reachable – meaning there are no active references pointing to them. If an object remains reachable, even if your code isn't actively using it, the garbage collector won't free up the memory it occupies. This leads to a gradual accumulation of unused memory, slowing down your application and potentially leading to crashes.
In React, memory leaks often stem from how components manage their lifecycle and interact with external resources. Common culprits include event listeners that aren't removed, subscriptions to data streams that aren't cancelled, and timers that aren’t cleared. These can all create unintended references, preventing the garbage collector from doing its job. A poorly optimized React application can quickly consume excessive memory, resulting in a frustrating user experience.
Leaks make apps sluggish. If the memory usage grows high enough, the browser tab will eventually crash. Finding these early prevents the slow performance degradation that users notice during long sessions.
Cleaning up event listeners
Event listeners are a frequent source of memory leaks in React. When a component mounts, it often attaches event listeners to elements – typically to the `window` or `document` object – to respond to user interactions or other events. If these listeners aren't removed when the component unmounts, they continue to hold a reference to the component, preventing it from being garbage collected.
Consider this example: a component mounts and adds a `scroll` event listener to the `window`. The event listener's callback function captures `this.state.someValue`. Even after the component unmounts, the `window` object still holds a reference to the callback, which in turn holds a reference to the component and its state. This creates a circular dependency that prevents garbage collection.
You fix this by removing the listener in the `useEffect` cleanup function. When the component unmounts, the cleanup runs, the reference to the callback breaks, and the garbage collector can do its job. If you skip this, every mount adds a new listener that never goes away.
Closures can add complexity. If your event listener callback closes over component state, that state will be retained as long as the event listener exists. Be mindful of what your closures capture and ensure you remove the listener when it's no longer needed. Modern React emphasizes functional components and `useEffect` for side effects, making cleanup a more explicit and manageable part of the component lifecycle.
- Remove listeners in the useEffect cleanup function.
- Be cautious of closures capturing component state.
- Use `useEffect` in functional components for managing side effects and cleanup.
Proper Event Listener Cleanup in useEffect
One of the most common sources of memory leaks in React applications occurs when event listeners are added but never removed. This creates a situation where the browser retains references to components that should have been garbage collected, leading to memory accumulation over time.
import React, { useState, useEffect } from 'react';

function WindowResizeComponent() {
  const [windowWidth, setWindowWidth] = useState(window.innerWidth);

  useEffect(() => {
    // Event handler function
    const handleResize = () => {
      setWindowWidth(window.innerWidth);
    };

    // Add event listener
    window.addEventListener('resize', handleResize);

    // Cleanup function - removes event listener
    return () => {
      window.removeEventListener('resize', handleResize);
    };
  }, []); // Empty dependency array means this runs once on mount

  return (
    <div>
      <h2>Current window width: {windowWidth}px</h2>
    </div>
  );
}

export default WindowResizeComponent;
The cleanup function returned by useEffect is crucial for preventing memory leaks. When the component unmounts or the effect dependencies change, React automatically calls this cleanup function. Without the removeEventListener call in the cleanup function, the event listener would persist even after the component is destroyed, maintaining a reference to the handleResize function and potentially the entire component scope. This pattern should be applied to all side effects that create persistent references, including timers, subscriptions, and DOM event listeners.
Subscriptions and Observables
Subscriptions to Observables, often managed with libraries like RxJS, are another common source of memory leaks. When a component subscribes to an Observable, it receives updates whenever the Observable emits a new value. If the component unmounts without unsubscribing, the subscription continues to hold a reference to the component, preventing garbage collection.
Let’s say a component subscribes to a stream of data from a WebSocket. The component stores the subscription in a class property. If the component unmounts without unsubscribing from the stream, the WebSocket connection and the subscription will continue to exist in memory, even though the component is no longer using them. This is especially problematic for long-lived components or applications with frequent component mounting and unmounting.
The key is to store the subscription object and unsubscribe from it in the `componentWillUnmount` or cleanup function. This explicitly breaks the reference, allowing the garbage collector to reclaim the memory. Forgetting to unsubscribe can quickly lead to a significant memory leak, especially if the Observable emits values frequently.
Fortunately, RxJS provides mechanisms to simplify subscription management. The `takeUntil` operator, for example, allows you to automatically unsubscribe from an Observable when a specific notifier Observable emits a value – typically an Observable that emits when a component unmounts. This provides a more robust and declarative way to manage subscriptions and prevent leaks.
- Store the subscription object.
- Unsubscribe in the `componentWillUnmount` or cleanup function.
- Consider using `takeUntil` for automatic unsubscription.
Timers and Intervals
`setTimeout` and `setInterval` are useful for scheduling tasks, but they can also introduce memory leaks if not handled carefully. When you use these functions, the callback function you provide is executed at a later time. If the component that created the timer has already unmounted, the callback function may still hold a reference to the component, preventing garbage collection.
Imagine a component that uses `setInterval` to update a timer display. The interval's callback function accesses `this.state.count`. If the component unmounts without clearing the interval, the callback will continue to execute, referencing the unmounted component and its outdated state. This creates a leak and can lead to unexpected behavior.
To prevent this, you must clear the timer using `clearTimeout` or `clearInterval` in the `componentWillUnmount` or cleanup function. This cancels the scheduled execution of the callback, releasing the reference to the component. It’s crucial to always pair `setTimeout` or `setInterval` with their corresponding clearing functions.
Be aware of closures capturing outdated component state. If the callback function closes over component state, that state will be retained as long as the timer is active. Ensure your callbacks reference the latest state or use functional updates to avoid stale closures.
Finding leaks with React DevTools
The React DevTools are an invaluable asset for identifying potential memory leaks. The profiler tab allows you to record a performance profile of your application, providing insights into component rendering and updates. By analyzing this profile, you can pinpoint components that are re-rendering unnecessarily or that are not being garbage collected.
To start, open the React DevTools and navigate to the 'Profiler' tab. Click the 'Record' button to begin recording a performance profile. Interact with your application to trigger the behavior you suspect is causing a leak. Once you've captured enough data, click 'Stop'.
The profiler displays a flame graph showing the component hierarchy and the time spent rendering each component. Look for components that are being updated frequently or that have a long render time. These components are potential candidates for optimization. You can also filter the profile to focus on specific components or updates.
The component tree allows you to inspect the props and state of each component. Examine these values to identify potential sources of leaks. For example, if a component is holding onto a large amount of data that is no longer needed, that could be a sign of a memory leak. Use the 'Highlight Updates' feature to pinpoint components that are unnecessarily re-rendering. The DevTools provide a solid starting point for diagnosing memory-related performance issues.
Leveraging Browser Performance Tools
Beyond React DevTools, your browser's built-in performance tools offer powerful capabilities for analyzing memory usage. Chrome DevTools and Firefox Developer Tools both provide features for taking heap snapshots, comparing snapshots, and tracking memory allocations.
To take a heap snapshot, open the DevTools and navigate to the 'Memory' tab. Select 'Heap snapshot' and click 'Take snapshot'. This captures a snapshot of the application's memory at that moment in time. Take multiple snapshots at different points in time to observe memory growth. Comparing snapshots allows you to identify objects that are being retained in memory and contributing to the leak.
The 'Allocation Instrumentation on Timeline' feature is particularly useful for tracking memory allocations over time. This allows you to see which parts of your code are allocating the most memory and when. This can help you identify the specific functions or components that are responsible for the leak. Tools like Spector.js provide even more granular control over memory analysis.
Analyzing heap snapshots requires some understanding of JavaScript's memory model. Look for objects that are being retained unexpectedly or that have a large retained size. These are potential indicators of a memory leak. The browser's performance tools, combined with React DevTools, provide a comprehensive toolkit for diagnosing and resolving memory issues.
State Management Library Comparison: Memory Leak Potential & Debugging
| Library | Complexity | Common Leak Patterns | Debugging Ease | Community Support |
|---|---|---|---|---|
| Redux | High | Unclosed subscriptions to store updates, forgotten event listeners in connected components, improper cleanup in effects (e.g., thunks). | Moderate - Redux DevTools offer time-travel debugging, but tracing leaks requires careful inspection of component lifecycles and action sequences. | Very High - Mature ecosystem with extensive documentation and a large user base. |
| Zustand | Low to Moderate | Potential for leaks if selectors unintentionally hold references to components, or if stores aren't properly unsubscribed from. | Moderate - Simpler store structure can make leak tracing easier than Redux, but dedicated debugging tools are less prevalent. | High - Growing community, good documentation, and increasing adoption. |
| Jotai | Low | Leaks can occur if atom values hold onto obsolete component references, or if derived atoms aren't correctly invalidated. | Moderate - Jotai's reactive nature can sometimes obscure the source of leaks; debugging relies on understanding atom dependencies. | Moderate - Active community, but smaller than Redux or Zustand. |
| Recoil | Moderate | Potential for leaks related to selectors and derived data if dependencies are not managed correctly. | Moderate - Recoil DevTools provide visibility into atom relationships, aiding in leak identification, but can be complex to interpret. | Moderate - Good, but smaller than Redux. Development is less active. |
| MobX | Moderate | Leaks can happen with unobserved observables or if components don't properly dispose of observers. | Moderate - MobX DevTools allow for tracking of observable dependencies, but pinpointing leaks requires understanding reactivity patterns. | High - Established library with a strong community and comprehensive documentation. |
Illustrative comparison based on the article research brief. Verify current pricing, limits, and product details in the official docs before relying on it.

No comments yet. Be the first to share your thoughts!