React 19 rendering shifts
React 19 changes how we think about rendering. With Server Components and the new Suspense API, React can now pause or abandon rendering tasks mid-stream. This isn't just a feature update; it's a fundamental shift in the model that breaks many of our old debugging habits.
Previously, debugging largely focused on client-side interactions and component lifecycles within the browser. Now, a substantial portion of rendering, particularly with Server Components, happens before code reaches the client. This means errors aren’t always immediately visible in the browser console, requiring a broader debugging strategy.
The introduction of concurrent rendering also means that the order in which components update might not be sequential, making it harder to reason about the state of the application at any given moment. Traditional breakpoints and step-through debugging can become less reliable, as components may be paused and resumed unexpectedly. This demands a new understanding of React’s internal mechanisms and a willingness to adapt debugging workflows.
These changes necessitate a shift in mindset for developers. Debugging React 19 applications requires a more holistic approach, encompassing server-side logs, error boundaries, and a deeper understanding of how data flows between the server and the client. Ignoring these changes will quickly lead to frustration when tracking down elusive bugs.
Finding errors in server components
Debugging errors within Server Components presents a unique challenge: errors don't consistently appear in the browser console as they do with client-side code. Because Server Components execute primarily on the server, many errors will only be visible in the server logs. This requires configuring logging effectively to capture relevant information.
Effective logging is paramount. Ensure your server environment is set up to log errors, warnings, and potentially even informational messages. Consider using a structured logging format like JSON to make it easier to parse and analyze logs. Services like Vercel and Netlify provide built-in logging capabilities, while for self-hosted solutions, you might use tools like Winston or Bunyan.
Common Server Component errors often stem from data fetching issues. These can include database connection failures, API request errors, or invalid data formats. Incorrect server-side logic, such as flawed calculations or conditional rendering, can also lead to unexpected behavior. Always validate data thoroughly before rendering it in a Server Component.
Another frequent issue arises from attempting to use client-side APIs (like `window` or `document`) directly within a Server Component. Remember that Server Components do not have access to the browser environment, so any code relying on these APIs will fail. The key difference is understanding where the code is executing – on the server or in the browser – and adjusting your approach accordingly. This is a fundamental shift from how we've debugged React in the past.
Fixing suspense bottlenecks
Suspense is designed to provide a better user experience by hiding loading states. However, this very feature can make debugging data fetching issues significantly more difficult. When a Suspense boundary encounters a slow or failing data fetch, it displays a fallback (like a loading indicator) without immediately revealing the underlying problem. This can leave developers staring at a loading screen, unsure of what’s actually happening.
The first step in debugging Suspense boundaries is identifying which boundary is causing the issue. React DevTools can help, but often, you’ll need to rely on logging and error boundaries (discussed later) to pinpoint the source of the problem. Strategically placed `console.log` statements around your data fetching logic can provide valuable insights.
Error boundaries are crucial when working with Suspense. Wrap your Suspense boundaries with error boundaries to catch any exceptions thrown during data fetching. This allows you to display a more informative error message to the user and log the error on the server. Without error boundaries, unhandled promise rejections within a Suspense boundary can lead to silent failures.
A common scenario is an infinite loading state. This often indicates a data fetching error that isn’t being caught. Ensure your data fetching functions handle errors gracefully and that your error boundaries are correctly configured to catch these errors. Also, verify that your data fetching logic isn’t stuck in a loop or making redundant requests. Consider using a timeout mechanism to prevent indefinite loading.
Debugging tools like Sentry can be particularly helpful in tracing data fetching errors within Suspense boundaries, providing detailed error reports and stack traces. Analyzing these reports can quickly reveal the root cause of the issue. Remember to instrument your components with Sentry's React integration to capture relevant error data.
DevTools in a concurrent world
The React DevTools have been updated to provide some support for debugging concurrent features, but their capabilities are still evolving. While the component tree view remains useful, it may not accurately reflect the order in which components are rendered due to concurrent rendering. The DevTools may show components as updating out of order, which can be confusing.
One of the most valuable tools within the DevTools is the profiler. Use the profiler to identify performance bottlenecks within Server Components and Suspense boundaries. This can help you pinpoint slow data fetching operations or inefficient rendering logic. Pay attention to the time spent in each component and look for areas where you can optimize.
Currently, the DevTools have limitations in visualizing the execution flow of concurrent code. It can be difficult to trace the exact sequence of updates and identify the cause of unexpected rendering behavior. Workarounds include strategically placed `console.log` statements and relying on server logs to understand the execution flow.
The React team is still updating DevTools for these features. Check the official release notes for new inspection tools as they arrive. Until then, you'll need to lean heavily on server logs and manual boundaries.
Error boundaries as a safety net
Error boundaries are your best tool for keeping an app alive when a component fails. They catch JavaScript errors in their child tree so the whole page doesn't go white. If you place them well, you can isolate a failure to a single sidebar or widget while the rest of the app stays functional.
Implementing error boundaries is straightforward. You can create a functional component that uses the `static getDerivedStateFromError()` lifecycle method to catch errors. This method allows you to update the component’s state to display an error message or fallback UI. You also need to implement `componentDidCatch()` (for class components) or a similar error handling mechanism in functional components.
Best practices for error boundary placement involve wrapping components that are likely to cause errors, such as those fetching data or interacting with external APIs. Avoid wrapping your entire application in a single error boundary, as this can mask underlying issues. Instead, use multiple error boundaries to isolate errors to specific parts of your application.
Common mistakes when using error boundaries include not handling errors correctly within the boundary itself, leading to silent failures. Another mistake is placing error boundaries too high up in the component tree, causing them to catch errors that should be handled at a lower level. Always ensure your error boundaries are designed to handle the specific types of errors that might occur within their child components.
- Use getDerivedStateFromError to update your state and show a fallback UI.
- Use `componentDidCatch()` (class components): Log errors for monitoring.
- Wrap components that fetch data or talk to external APIs specifically.
- Avoid overly broad boundaries: Isolate errors effectively.
Logging for server and client
Effective logging is critical for debugging React 19 applications, given the shift towards server-side rendering and concurrent features. The key is to implement distinct logging strategies for both Server Components and Client Components. Server Components require logging on the server, while Client Components can leverage browser-based logging tools.
For Server Components, use structured logging to make it easier to analyze logs. Include relevant information such as timestamps, log levels (e.g., error, warning, info), component names, and request IDs. This allows you to quickly identify the source of errors and track down issues. Consider using a logging library like Winston or Bunyan to streamline the process.
Client-side logging can be achieved using `console.log`, but for more advanced scenarios, consider integrating with monitoring services like Sentry or Datadog. These services provide features such as error tracking, performance monitoring, and user session replay, which can be invaluable for debugging complex issues.
Integrating logging with monitoring services allows you to correlate server-side and client-side logs, providing a more complete picture of what’s happening in your application. This is particularly useful when debugging issues that involve interactions between the server and the client. Remember to sanitize sensitive data before logging it to prevent security vulnerabilities.
Common bugs and fixes
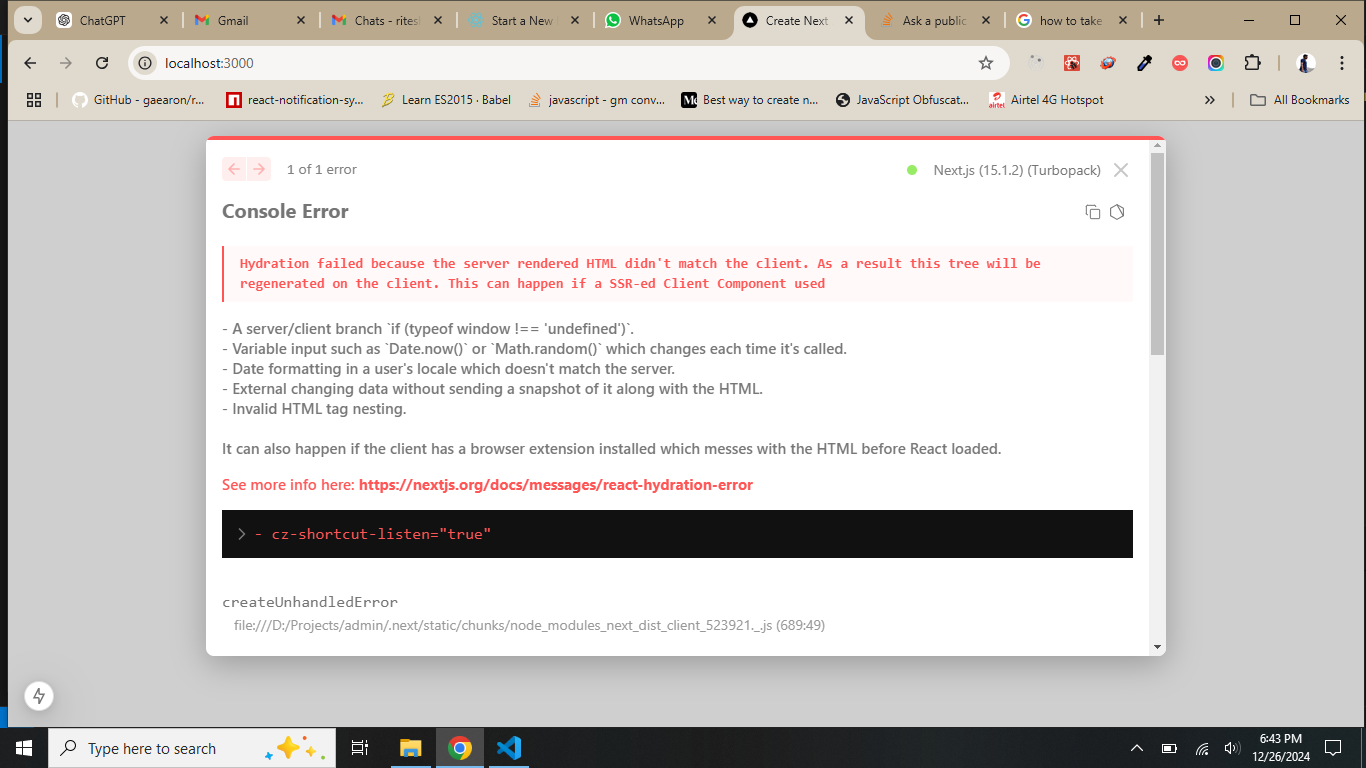
Let's look at a few common debugging scenarios you might encounter with Server Components and Suspense and how to address them. First, consider a scenario where a Server Component is attempting to fetch data from an API, but the API is unavailable. The component throws an error, but it doesn’t surface in the browser console. Solution: Configure server-side logging to capture the error and examine the logs for details. Implement an error boundary around the component to display a fallback UI.
Next, imagine a Suspense boundary that is stuck in a loading state indefinitely. The user sees a loading indicator, but the data never appears. Solution: Use the React DevTools profiler to identify any slow or blocking operations within the Suspense boundary. Check the network requests to ensure the data is being fetched correctly. Implement error boundaries to catch any data fetching errors.
Finally, suppose you encounter unexpected rendering behavior in a Server Component. The component renders incorrectly, but there are no obvious errors in the console. Solution: Add `console.log` statements to the component to track the values of key variables and the execution flow. Use the React DevTools to inspect the component’s props and state. Verify that the component’s logic is correct and that it’s handling data properly.
These scenarios highlight the importance of a multi-faceted debugging approach. Combining server-side logging, error boundaries, the React DevTools, and strategic `console.log` statements is the most effective way to diagnose and resolve issues in React 19 applications. Remember to isolate the problem, gather as much information as possible, and test your solutions thoroughly.

No comments yet. Be the first to share your thoughts!