
Why AI changes debugging
Traditional debugging often feels like searching for a needle in a haystack. Developers spend hours manually tracing execution paths, reading stack traces, and guessing where a variable went wrong. AI changes this dynamic by shifting the focus from manual tracing to automated root-cause analysis.
Instead of just highlighting an error, modern AI tools examine the surrounding code context to suggest precise fixes. They can identify logic errors, missing imports, or syntax issues in seconds. This automation removes the guesswork, allowing developers to resolve issues before they impact users.
By handling the heavy lifting of pattern recognition, these tools let you spend more time building features and less time hunting for bugs. The result is a faster, more reliable development cycle that scales with your team's output.
5 Best AI Debugging Tools for 2026
Finding the right AI debugging tool in 2026 means prioritizing concrete capabilities over marketing hype. We evaluated top contenders based on actual performance, integration ease, and real-world developer utility to help you pick the best fit for your workflow.
1. GitHub Copilot Chat for inline code fixes
Copilot Chat integrates directly into your IDE, allowing you to highlight buggy code and request immediate inline fixes. It understands the surrounding context to suggest precise patches rather than generic advice. This feature significantly reduces the time spent hunting for syntax errors or logic flaws, making it a staple for daily development workflows.

2. Amazon CodeWhisperer security vulnerability scanning
CodeWhisperer goes beyond simple autocompletion by actively scanning your code for security vulnerabilities. It identifies potential risks like SQL injection or exposed credentials in real-time. Developers receive actionable recommendations to remediate these issues immediately, ensuring that security is baked into the development process rather than treated as an afterthought.

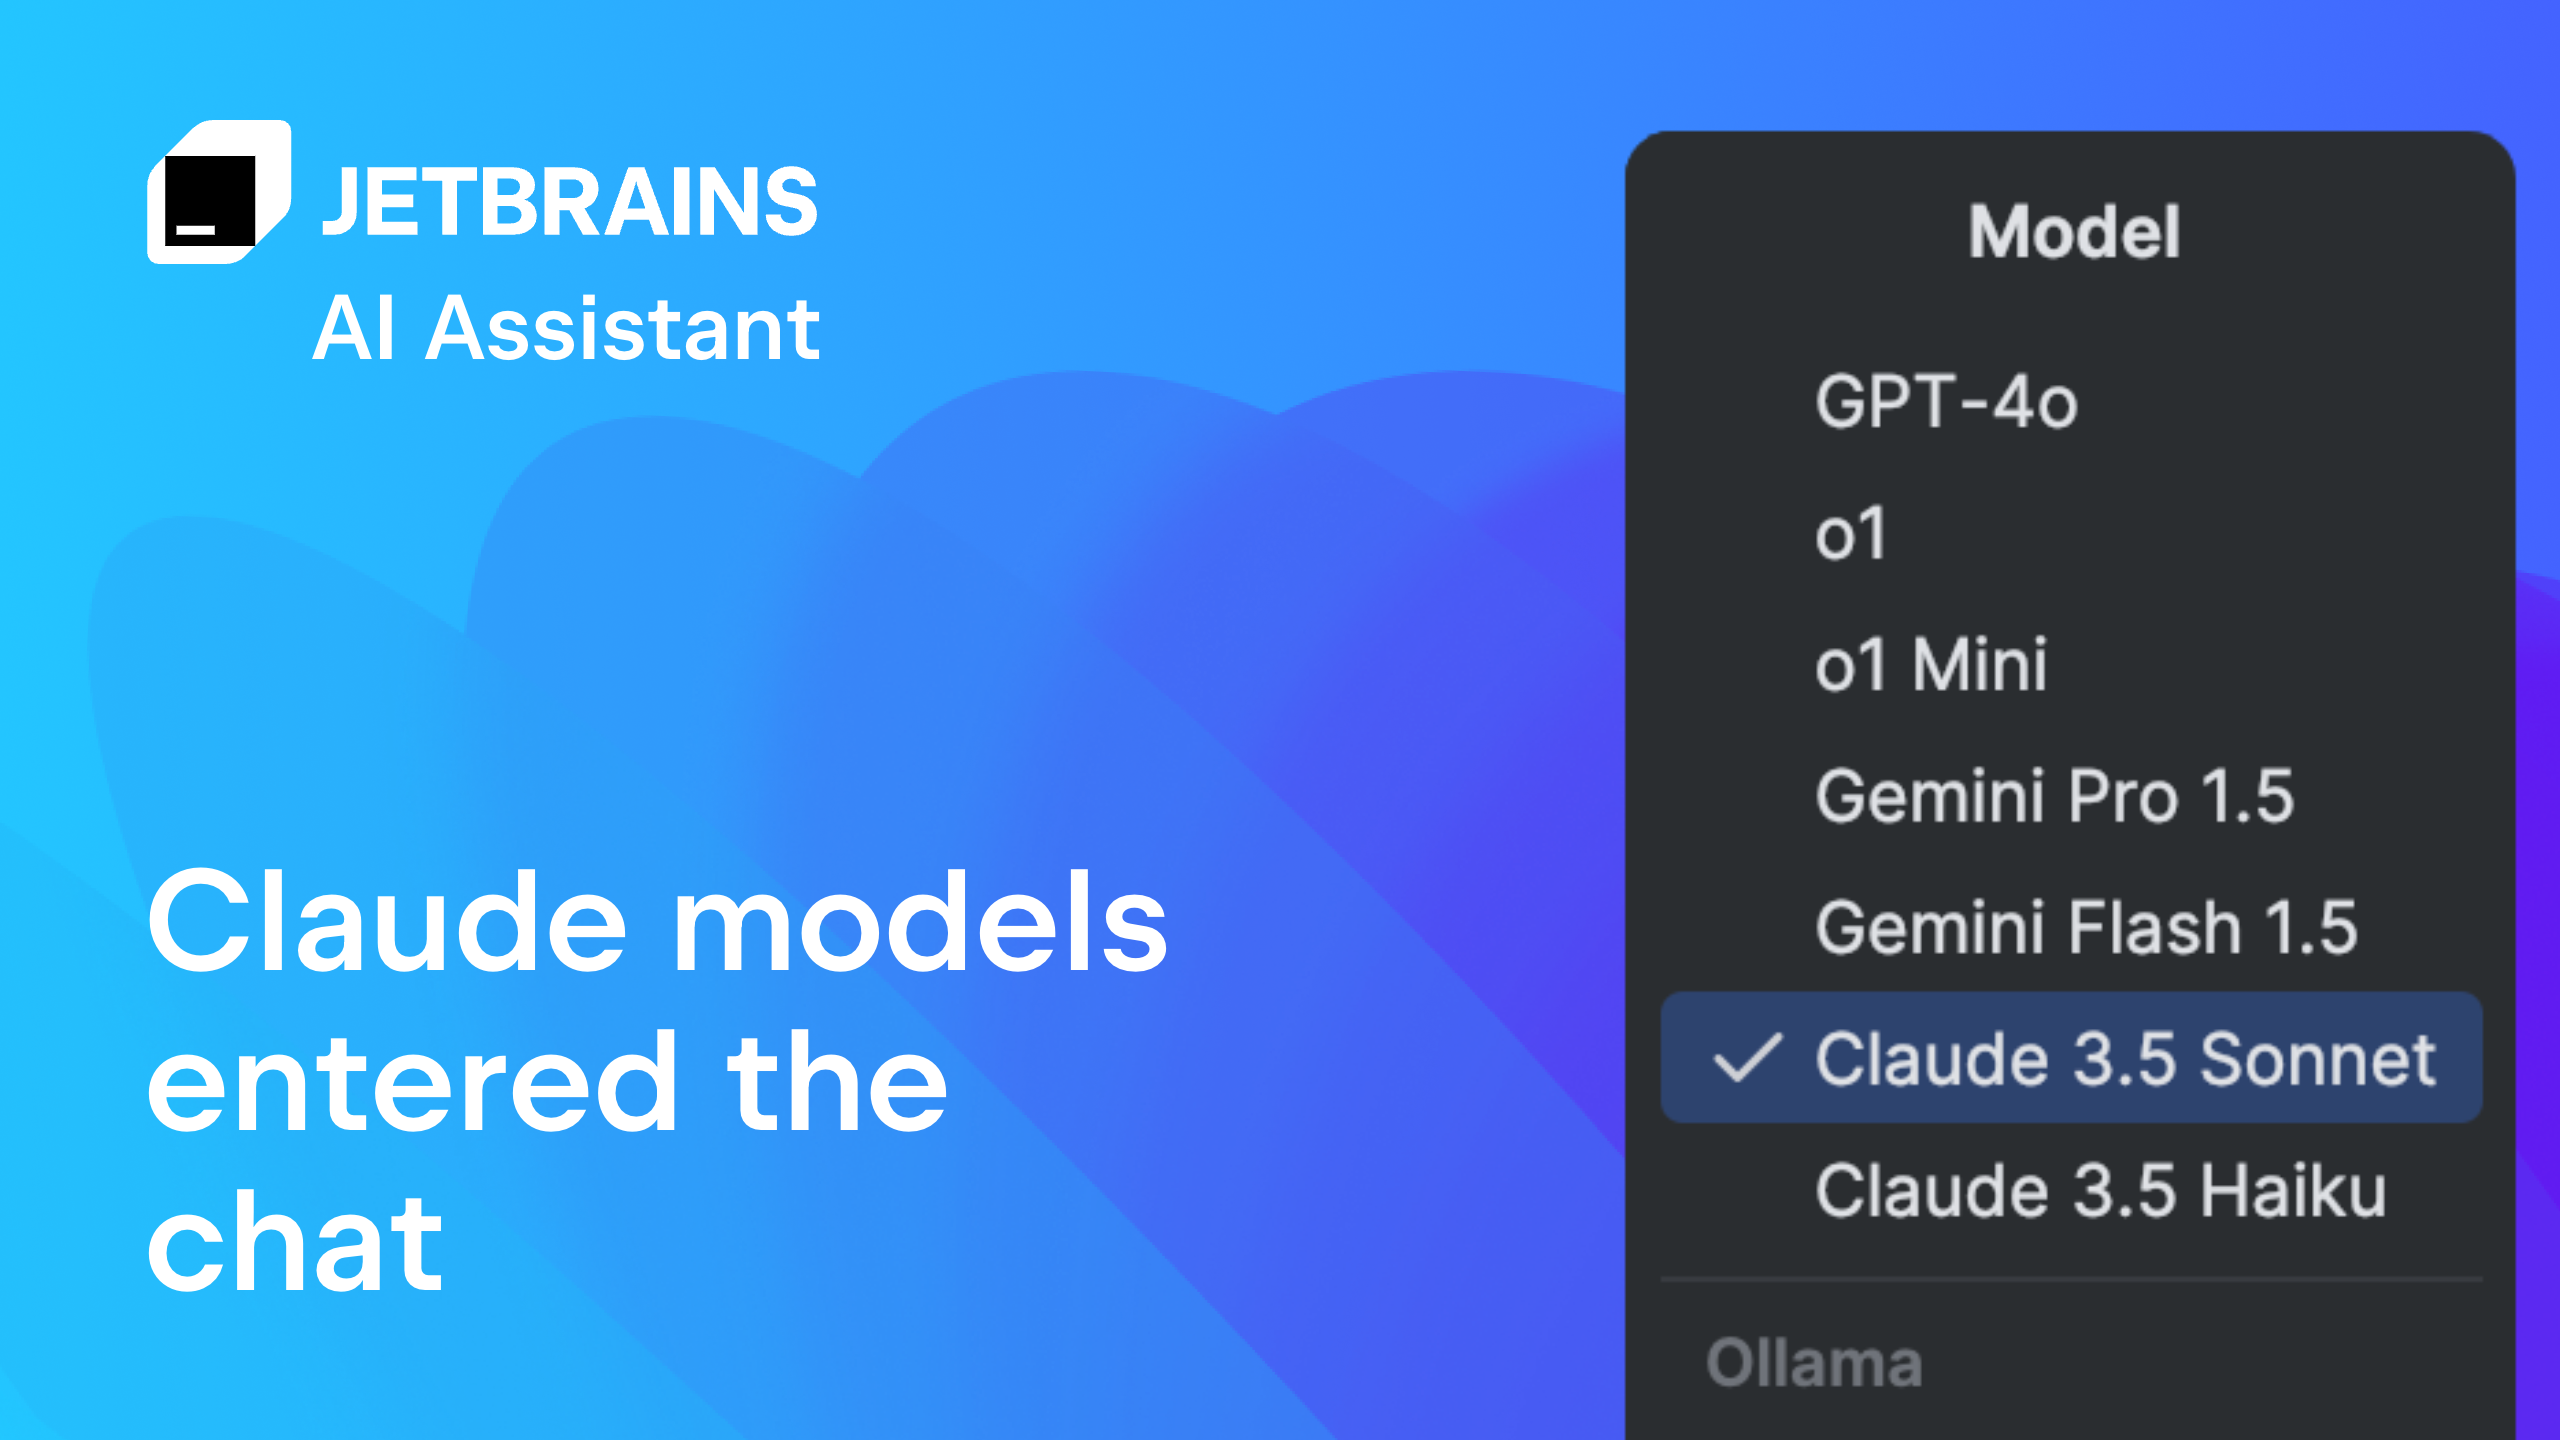
3. JetBrains AI Assistant context-aware refactoring
The JetBrains AI Assistant excels at context-aware refactoring within the IntelliJ ecosystem. It understands complex code structures and suggests improvements that maintain functionality while enhancing readability. This tool helps developers clean up technical debt efficiently, transforming messy codebases into maintainable, well-structured applications without breaking existing logic.
4. Replit Agent autonomous debugging workflows
Replit Agent operates as an autonomous debugging partner, capable of running tests and fixing errors across entire projects. It navigates complex dependency trees and resolves conflicts that might stall manual debugging sessions. This automation allows developers to focus on feature creation while the agent handles the tedious aspects of error resolution.

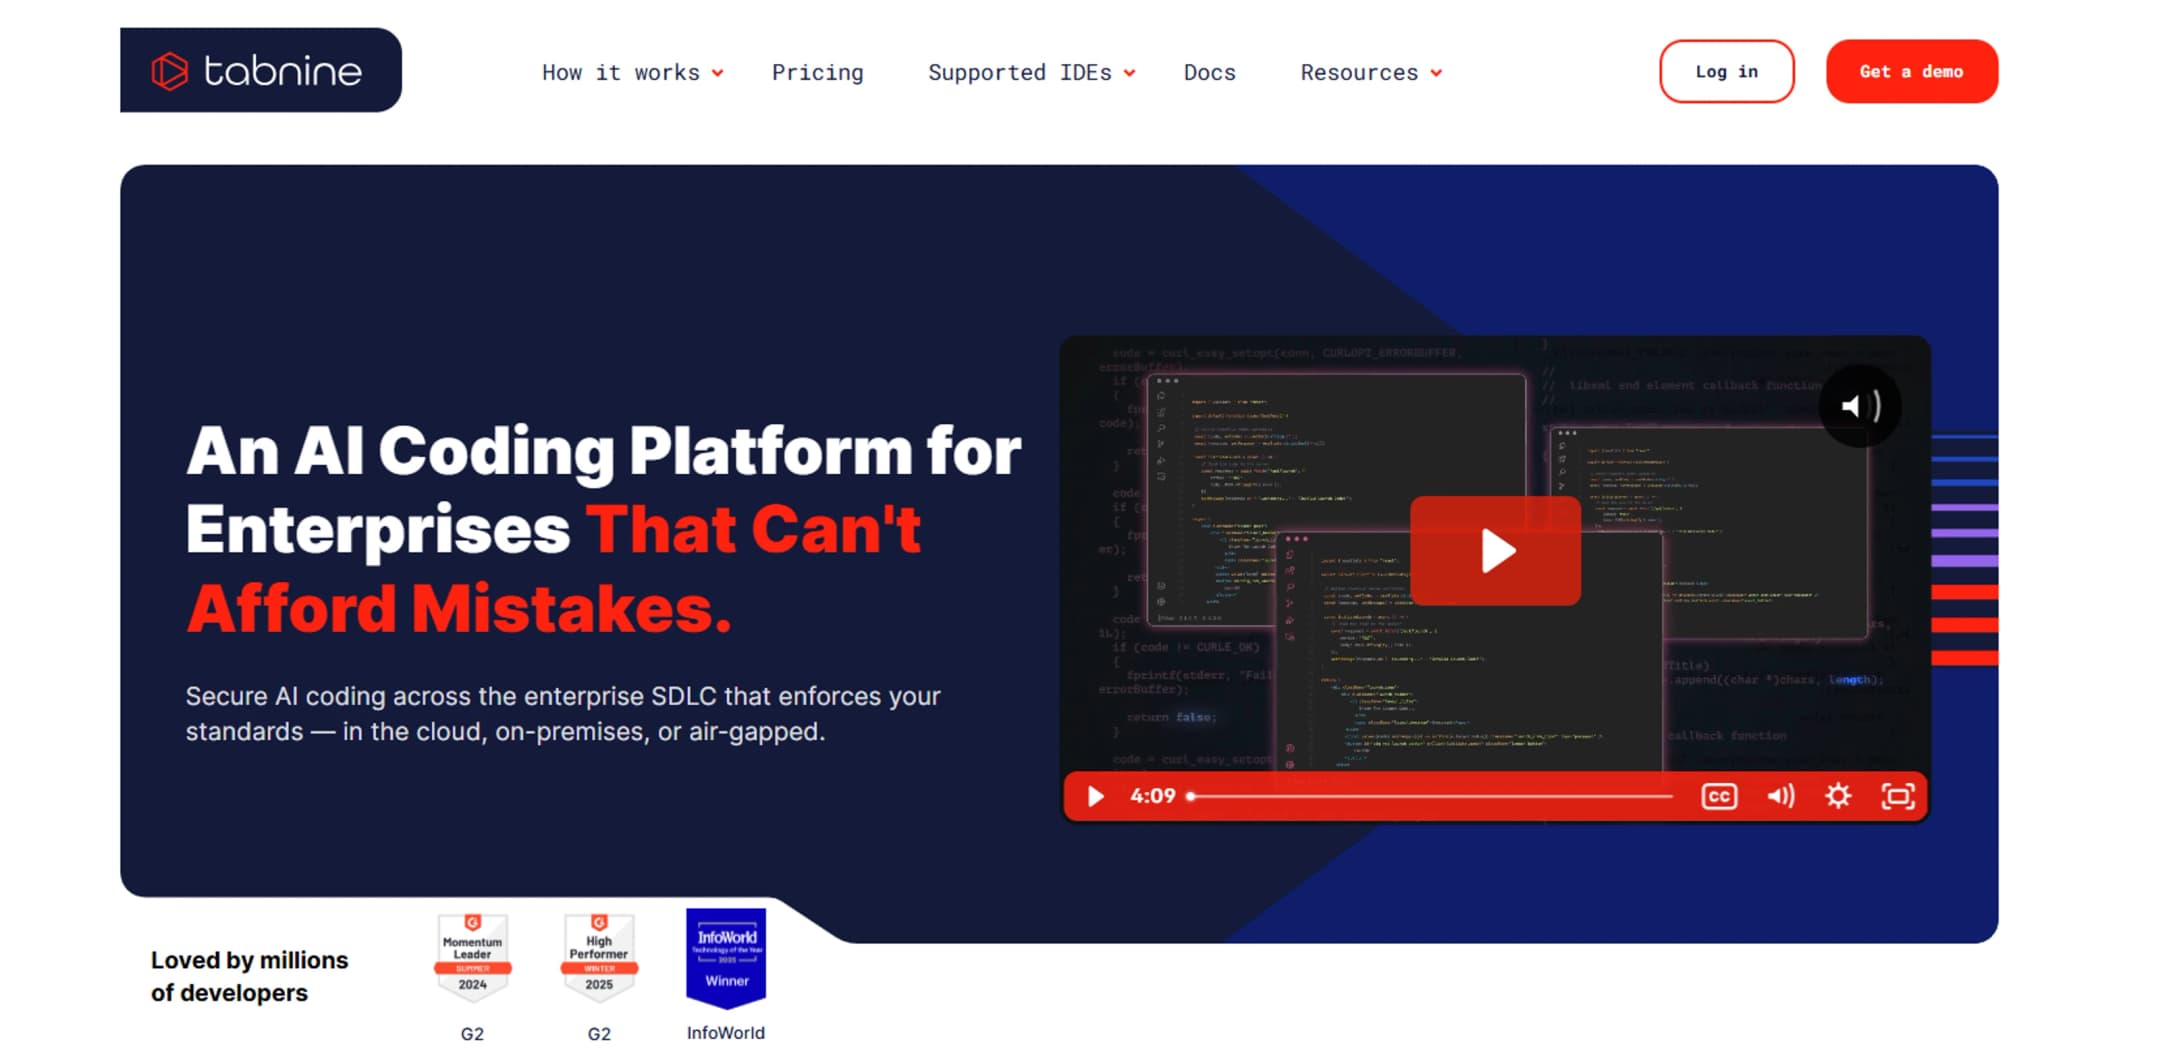
5. Tabnine Enterprise private code analysis
Tabnine Enterprise prioritizes data privacy by keeping all code analysis within your private infrastructure. It trains on your organization’s specific codebase, providing highly relevant suggestions without exposing sensitive intellectual property to external models. This approach ensures compliance with strict security standards while still leveraging the power of AI-driven development assistance.
How to pick the right AI debugging tool
Choosing an AI debugging tool isn't about finding the most feature-rich platform; it's about finding the one that fits your current stack without forcing a workflow overhaul. Most developers waste time evaluating tools based on marketing claims rather than practical integration. Instead, focus on three concrete criteria: language support, IDE integration, and error handling scope.
First, verify native support for your primary languages. An AI tool that excels at Python but struggles with TypeScript will slow down a full-stack team. Look for tools that offer deep language server protocol (LSP) integration, allowing them to understand your codebase context rather than just analyzing isolated snippets.
Second, prioritize IDE-native experiences. If the AI requires switching to a separate browser window or dashboard, friction increases. The best tools embed directly into VS Code, JetBrains IDEs, or Xcode, offering inline suggestions and quick fixes without breaking your flow. This seamless integration turns debugging from a reactive chore into a proactive habit.
Finally, consider the types of errors you face most often. Some AI tools specialize in runtime exceptions and crash dumps, while others focus on static analysis and code quality. Match the tool's strength to your pain points. A mobile developer might need Instabug for user-reported bugs, while a backend engineer might prefer Sentry for automated error tracking.
| Criteria | What to Look For |
|---|---|
| Language Support | Native support for your primary stack (e.g., Python, JS, Go) |
| IDE Integration | In-IDE suggestions without context switching |
| Error Scope | Specialization in runtime crashes vs. static code analysis |
Start with a free trial to test the tool in your actual development environment. If it doesn't reduce your debugging time within the first week, it's likely adding more noise than signal.
Frequently asked: what to check next
Helpful gear
Use these product recommendations as a starting point, then choose the size, material, and price point that fit how you actually use the gear.


As an Amazon Associate, we may earn from qualifying purchases.

No comments yet. Be the first to share your thoughts!