Debugging Tools Selection Criteria
We picked the five tools in this roundup by focusing on what actually matters when code breaks: speed of identification and ease of use. The goal isn't to list every available debugger, but to highlight solutions that handle the messy reality of modern development, including AI-generated snippets that often introduce subtle logic errors.
Our evaluation process weighed three main factors. First, we looked at integration depth. A tool that requires leaving your editor adds friction, so we prioritized those that work seamlessly within VS Code, JetBrains IDEs, and command-line workflows. Second, we tested their ability to parse complex stack traces and suggest fixes, a critical feature when debugging code you didn't write. Finally, we checked for community support and documentation, ensuring you can find help when the tool itself throws an error.
Note: We avoided tools that are strictly for legacy systems or require expensive enterprise licenses unless they offer a free tier powerful enough for individual developers.
The result is a list of tools that balance raw power with developer experience. Each entry below includes a short note on where it shines, so you can choose the right instrument for your specific debugging headache.
5 Debugging Tools for 2026: Fixing AI-Generated Code Bugs Faster
AI-generated code often introduces subtle logic errors that standard linters miss. These five tools are selected for their ability to catch hallucinated syntax and broken dependencies in real-time, helping you ship cleaner code faster.
1. Cursor AI Editor for Contextual Bug Fixes
Cursor acts as your pair programmer, understanding your entire codebase to pinpoint AI-generated errors. Its multi-file editing and terminal integration allow you to fix related bugs simultaneously. This contextual awareness speeds up resolution by reducing manual context switching. The tool suggests corrections based on project-specific patterns, making it ideal for complex refactoring tasks.

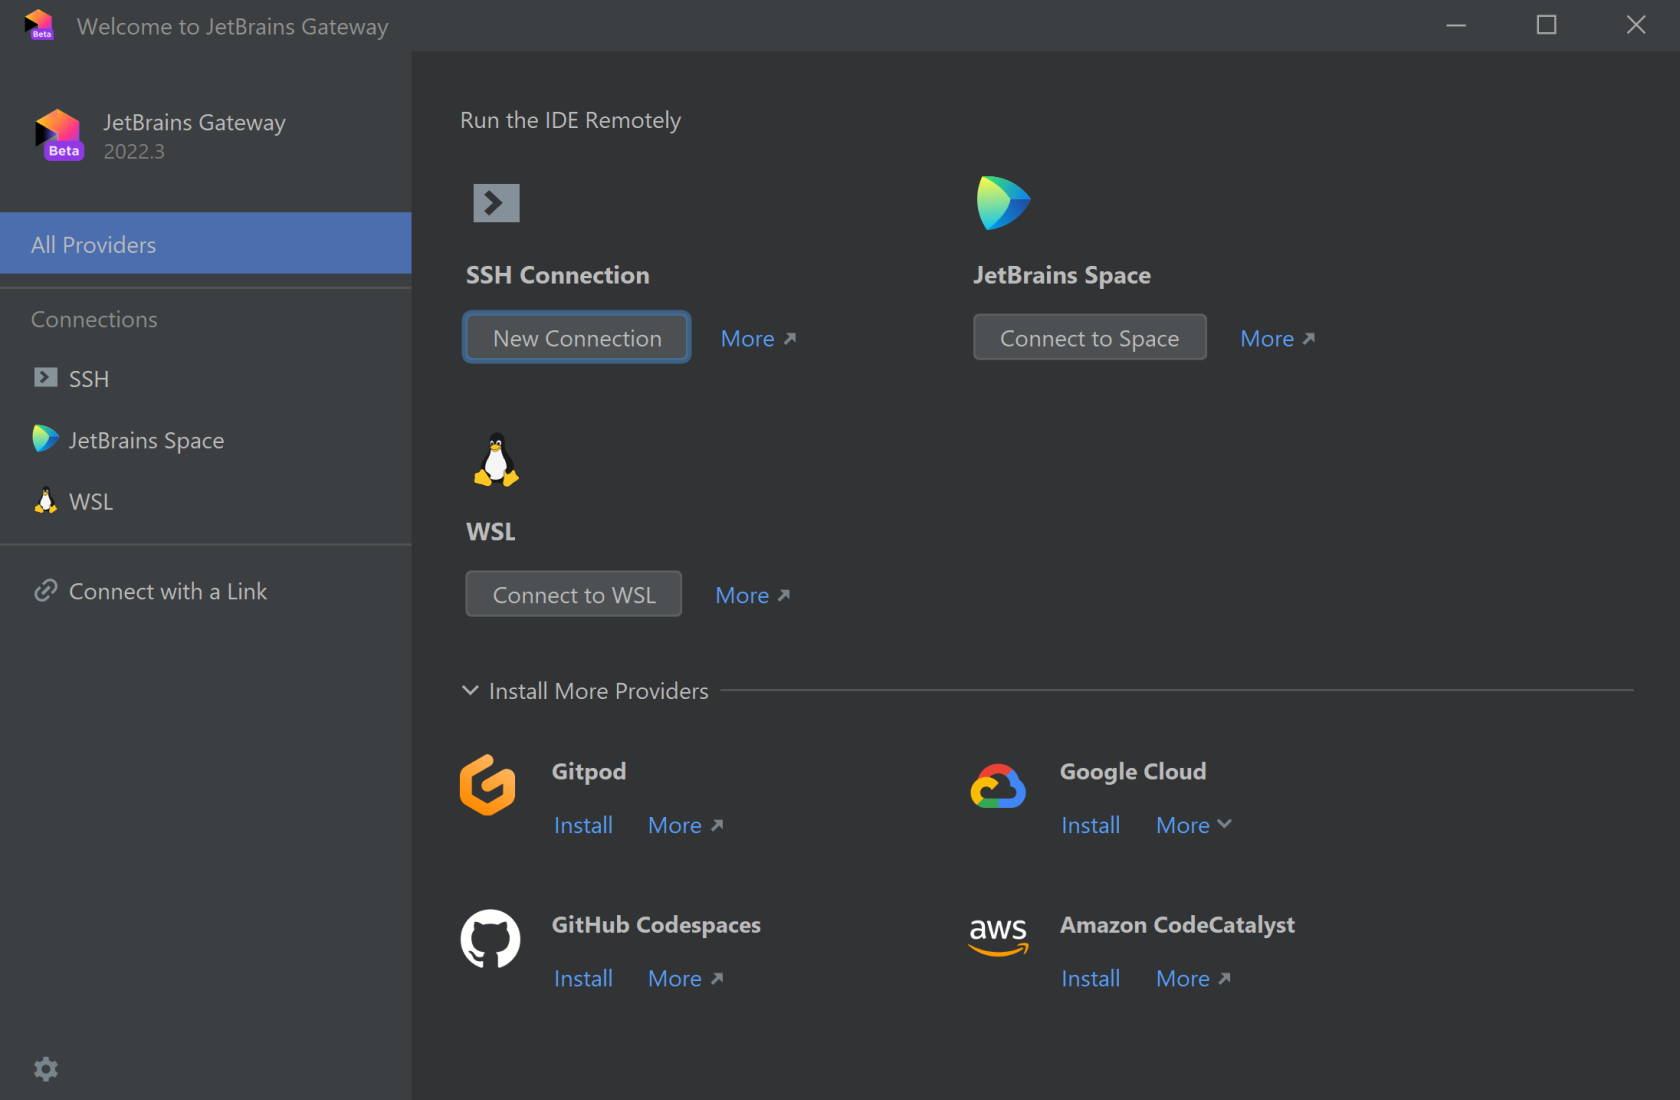
2. JetBrains Space for Collaborative Code Review
JetBrains Space centralizes your development workflow, enabling seamless code reviews directly within the platform. Its integrated chat and issue tracking keep discussions tied to specific commits, preventing miscommunication. Teams can review AI-generated snippets in real-time, ensuring quality control before merging. This unified environment reduces tool fatigue and accelerates feedback loops.
3. Sentry for Real-Time Error Tracking
Sentry captures runtime errors instantly, providing stack traces and context for AI-generated code failures. Its release tracking helps identify when bugs were introduced, linking them to specific deployments. The platform offers source maps for better readability and automatic issue grouping. This proactive monitoring ensures you catch critical failures before they impact users, maintaining system stability.

4. Datadog APM for Performance Bottleneck Detection
Datadog Application Performance Monitoring visualizes request flows, highlighting latency spikes caused by inefficient AI code. Its distributed tracing maps dependencies, helping you isolate slow database queries or external API calls. The platform provides customizable dashboards and anomaly detection to spot performance regressions early. This visibility ensures your applications remain responsive even as complexity grows.
5. GitHub Copilot Workspace for Automated Patching
GitHub Copilot Workspace generates full pull requests with comprehensive tests and documentation for bug fixes. It analyzes the issue description and codebase to propose targeted patches, reducing manual coding effort. The workspace integrates directly with GitHub, allowing reviewers to see the rationale behind each change. This automation accelerates the resolution process while maintaining code quality standards.

Pick the right fit
Choosing a debugging tool is less about finding the most popular option and more about matching the tool to your specific workflow. AI-generated code often introduces subtle logic errors that standard syntax checkers miss, so your debugging environment needs to handle both traditional syntax issues and complex behavioral anomalies.
Start by identifying where your code breaks. If you are working with large, compiled languages like C++ or Rust, a low-level debugger like GDB or WinDbg provides the necessary access to memory and stack traces. For interpreted languages like Python or JavaScript, IDE-integrated debuggers (such as those in VS Code or PyCharm) offer a more streamlined experience with visual breakpoints and variable inspection.
Consider the integration depth. A standalone CLI tool might be powerful, but if it requires manual command-line flags for every session, it adds friction to your AI-assisted workflow. Look for tools that integrate directly with your editor, allowing you to pause execution and inspect AI-generated functions without switching contexts.
Evaluate your language and environment
Different languages require different debugging approaches. Compiled languages often need external debuggers that can attach to running processes, while interpreted languages usually have built-in debuggers that are easier to configure. Check if your primary development environment supports the debugger natively or if it requires additional extensions.
Check AI compatibility
Since you are debugging AI-generated code, ensure the tool can handle generated syntax patterns. Some AI-generated code uses unconventional variable naming or nested structures that older debuggers might struggle to parse. Test the tool with a sample of AI-generated code to see if it can accurately map variables and control flow.
Assess performance impact
Debuggers can slow down your application, especially in production-like environments. Lightweight debuggers are preferable for local development, while more robust tools might be necessary for analyzing complex crash dumps. Consider whether the performance overhead is acceptable for your current stage of development.
Review documentation and community support
A tool is only as good as its documentation. If you encounter an obscure error, having access to clear documentation or an active community can save hours of troubleshooting. Prioritize tools with extensive resources, as AI debugging often involves unique edge cases that require community insights.
| Feature | CLI Based | IDE Integrated | AI Code Support |
|---|---|---|---|
| Low-level Control | Yes | No | Medium |
| Visual Inspection | No | Yes | High |
| Memory Analysis | Yes | Limited | Medium |
| Quick Setup | No | Yes | High |


As an Amazon Associate, we may earn from qualifying purchases.

No comments yet. Be the first to share your thoughts!