
Why AI debugging tools matter now in 2026
The traditional debugging workflow—manually stepping through code, inspecting variables, and chasing stack traces—is increasingly at odds with the velocity of modern software development. As applications grow in complexity and microservices expand, the cognitive load on developers to locate root causes has become a significant bottleneck. AI-powered debugging tools shift this paradigm by moving from reactive stepping to proactive diagnosis, a trend that defines the developer experience in 2026.
These tools integrate directly into IDEs like Visual Studio Code or JetBrains environments, using large language models to understand code context beyond simple syntax. Instead of merely highlighting an error, they analyze the surrounding logic, library dependencies, and historical commit patterns to suggest precise fixes. This reduces the mean time to resolution (MTTR) by automating the initial identification phase, allowing engineers to focus on architectural decisions rather than syntax errors.
The value proposition is clear: by offloading the tedious task of error localization to AI, development teams can maintain higher throughput without sacrificing code quality. This article examines the top AI-enhanced debugging solutions that streamline this process, helping you choose the right assistant for your specific tech stack and workflow.
10 Best AI-Powered Debugging Tools for Faster Code Fixes
These AI-powered debugging tools automate error detection and resolution, reducing mean time to repair through intelligent code analysis. The following selection highlights platforms with robust IDE integration and real-time diagnostic capabilities to streamline developer workflows.
1. GitHub Copilot Chat
GitHub Copilot Chat integrates directly into your IDE to analyze error logs and suggest targeted fixes. It understands context from your open files, allowing developers to ask natural language questions about stack traces. The tool provides inline code suggestions that resolve syntax errors and logical bugs, streamlining the debugging workflow without leaving the editor environment.
2. Amazon CodeWhisperer
Amazon CodeWhisperer offers real-time security scans and code recommendations as you type. It identifies potential vulnerabilities and logic errors, providing immediate fixes for common debugging issues. The tool integrates seamlessly with major IDEs, analyzing your code structure to suggest corrections that maintain both functionality and security standards throughout the development process.

3. Visual Studio IntelliCode
Visual Studio IntelliCode enhances the debugging experience with AI-assisted code completion and error detection. It learns from your codebase to predict likely fixes for syntax and logical errors. The tool provides intelligent suggestions that adapt to your coding style, helping developers resolve issues faster by highlighting potential bugs and offering context-specific corrections directly in the editor.

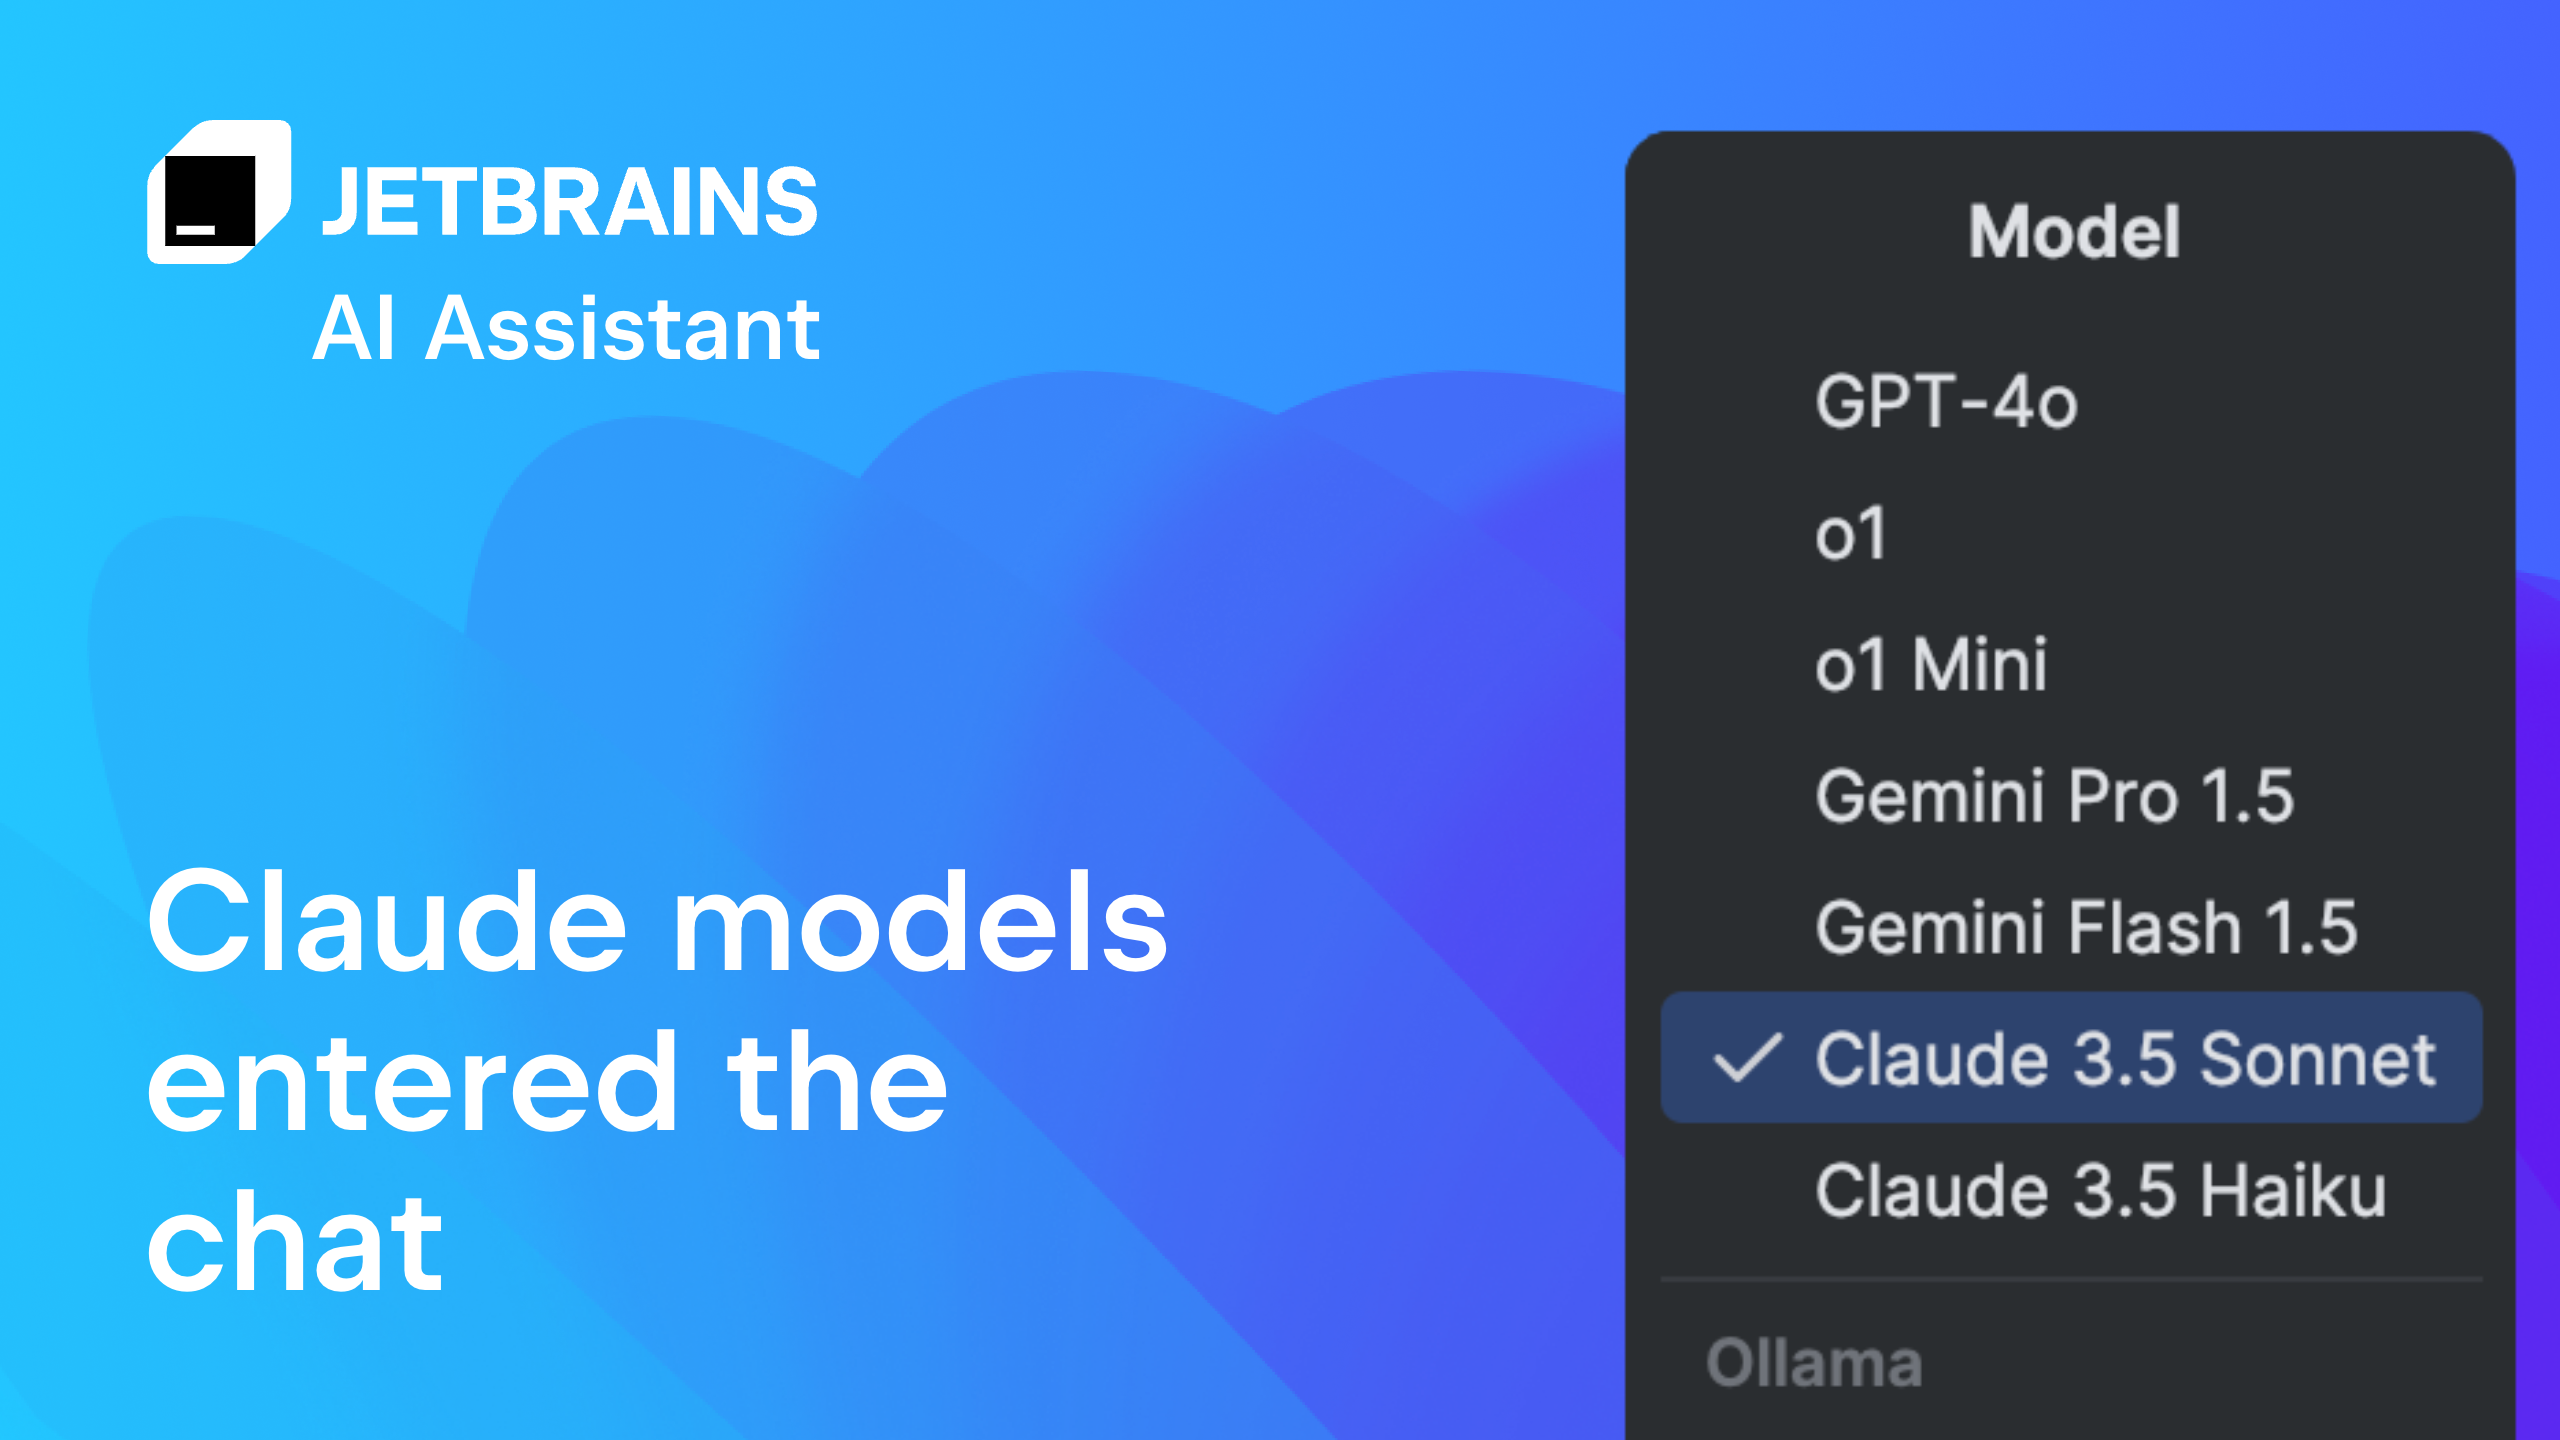
4. JetBrains AI Assistant
The JetBrains AI Assistant embeds deeply into the IDE to provide contextual debugging help. It analyzes code snippets and error messages to suggest precise fixes, reducing the time spent searching for solutions. The assistant understands the broader project context, offering recommendations that align with existing code patterns and best practices, making it a powerful ally for complex debugging tasks.
5. Sentry AI
Sentry AI automates error resolution by analyzing production issues and suggesting code fixes. It integrates with your existing error tracking to provide actionable insights and potential solutions directly from the dashboard. The tool helps developers quickly identify the root cause of bugs and apply fixes, reducing downtime and improving overall application stability through intelligent, data-driven debugging recommendations.

6. Chrome DevTools AI
Chrome DevTools now integrates AI-driven insights directly into the browser environment, streamlining frontend debugging. This feature analyzes network requests and performance metrics to suggest optimizations without leaving the developer workspace. It simplifies identifying bottlenecks in complex web applications by providing contextual recommendations for faster load times and smoother user interactions.

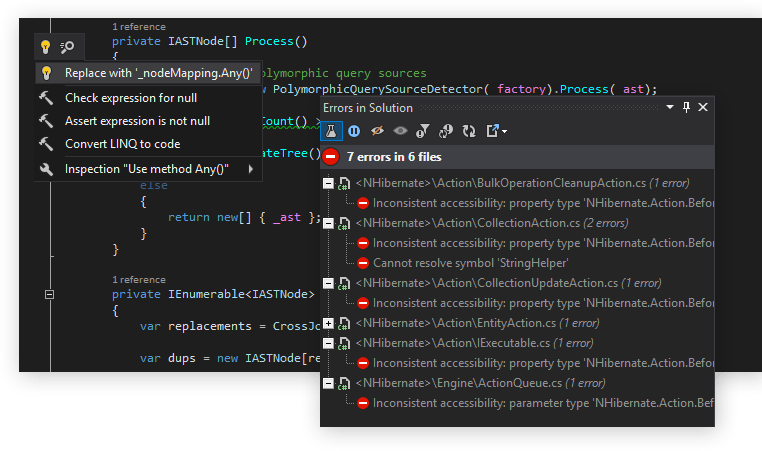
7. ReSharper Ultimate
ReSharper Ultimate enhances Visual Studio with deep code analysis and intelligent refactoring capabilities. Its AI components help identify potential bugs and security vulnerabilities before compilation, ensuring cleaner codebases. Developers benefit from automated suggestions for improving performance and readability, making it an essential tool for large-scale .NET projects requiring rigorous quality standards.
8. PyCharm Professional
PyCharm Professional offers advanced debugging tools tailored for Python development, including intelligent code completion and remote interpreter support. Its AI-driven insights assist in identifying logical errors and optimizing database queries within Django or Flask applications. This IDE streamlines the debugging process by providing contextual help and automated fixes, allowing developers to focus on building robust backend services efficiently.

9. WinDbg and WinUI
WinDbg combined with WinUI debugging capabilities provides powerful tools for Windows application development. It supports time-travel debugging, allowing developers to replay execution steps to isolate complex race conditions and memory leaks. This combination is critical for system-level debugging, offering deep visibility into kernel-mode interactions and ensuring stability for high-performance Windows desktop applications.

10. Postman AI
Postman AI revolutionizes API testing by automating the creation of test cases and identifying anomalies in responses. It learns from existing workflows to suggest improvements and detect potential integration failures early in the development cycle. This tool accelerates the debugging of API endpoints by providing intelligent insights into request structures and response validations, ensuring reliable communication between services.

Compare Top AI Debugging Tools
Choosing the right AI-powered debugger requires balancing cost, language ecosystem, and integration depth. The table below outlines the core specifications for ten leading tools, helping you identify which solution aligns with your development stack and budget constraints.
Most tools offer a free tier for individual developers, making it easy to test AI capabilities before committing to a paid plan. Enterprise features like private model training and SSO integration are typically reserved for higher-tier subscriptions. When evaluating these options, prioritize tools that integrate directly into your existing IDE workflow to minimize context switching.
Shop for development tools
Selecting the right hardware and software stack is essential for maximizing the efficiency of AI-powered debugging workflows. The following recommendations focus on developer-centric environments that pair well with intelligent code analysis tools.


As an Amazon Associate, we may earn from qualifying purchases.
These tools provide the foundational infrastructure needed to leverage AI-driven insights effectively. Pairing a robust IDE with ergonomic hardware ensures sustained productivity during complex debugging sessions.

No comments yet. Be the first to share your thoughts!