Why AI debugging matters now
Debugging has always been the most time-consuming part of writing code. For years, the process relied on a developer stepping through lines one by one, reading error logs, and guessing where the logic broke. It is a slow, manual hunt for the root cause. By 2026, that manual stepping is no longer the only option. AI debugging tools have shifted the workflow from simple error highlighting to active root cause analysis and auto-fixes.
The difference is significant for development teams. Instead of spending hours isolating a bug, AI assistants can now scan the codebase, identify the specific line causing the failure, and suggest the exact patch needed. This automation drastically reduces the mean time to resolution (MTTR). You are no longer just finding the problem; you are getting a working solution instantly.
This shift allows developers to focus on architecture and feature development rather than chasing down syntax errors or edge cases. The best AI debugging tools for 2026 integrate directly into your editor, understanding the context of your entire project rather than just a single file. They act as a second pair of eyes that never gets tired, catching issues before they reach production.
5 Best AI Debugging Tools for 2026: Automate Fixes and Code Review
By 2026, manual debugging is a bottleneck you can no longer afford. We’ve identified five AI debugging tools that automate fixes and streamline code review, turning error resolution from a chore into a background process.
1. GitHub Copilot Chat for inline code fixes
GitHub Copilot Chat integrates directly into your IDE, allowing you to highlight buggy code and request immediate inline fixes without context switching. It understands your local repository structure, making it a powerful ally for rapid refactoring. The tool excels at explaining complex logic and suggesting cleaner implementations, streamlining the debugging workflow for everyday developer tasks.

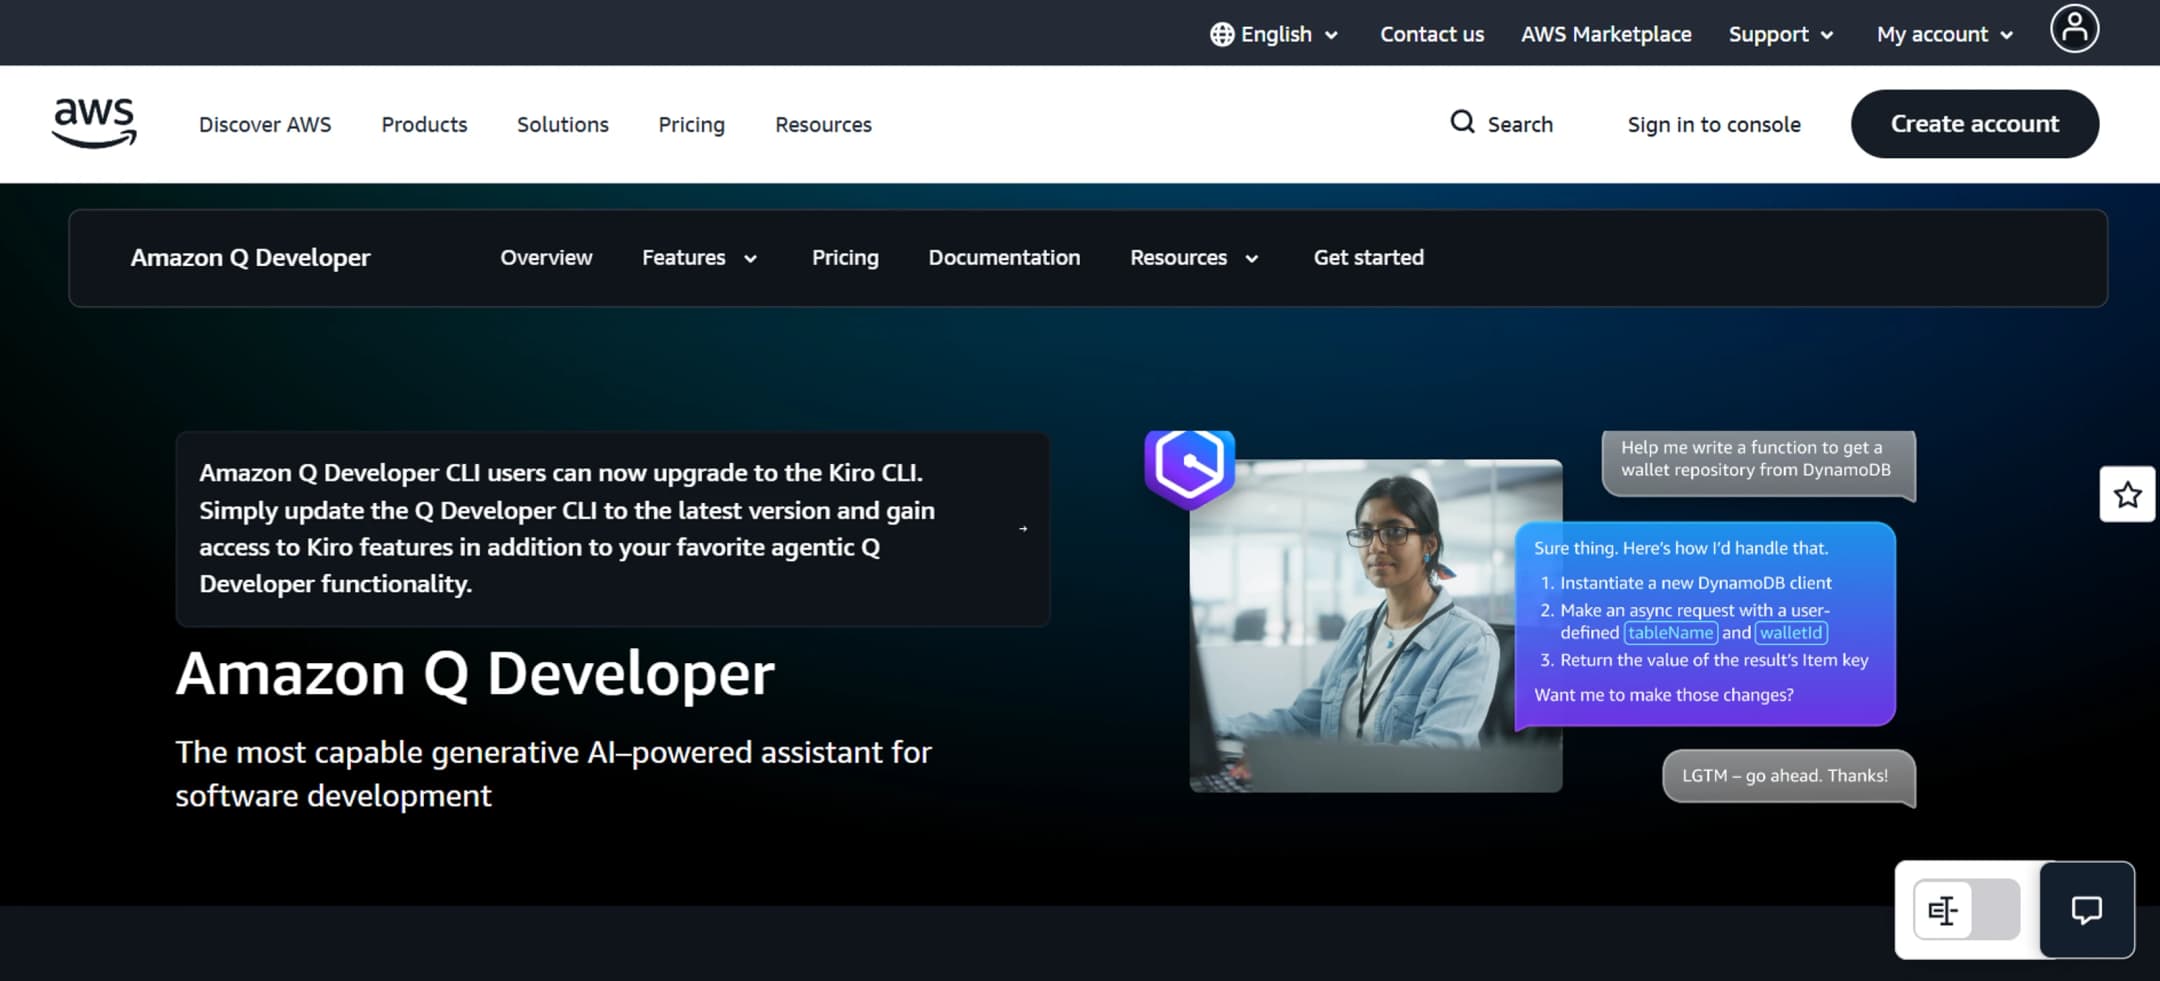
2. Amazon CodeWhisperer security vulnerability scanning
Amazon CodeWhisperer goes beyond syntax correction by actively scanning your codebase for security vulnerabilities and compliance issues. It identifies potential risks like SQL injection or exposed credentials in real-time, offering secure code suggestions to remediate them. This proactive approach ensures your applications remain robust against common security threats while you write code.

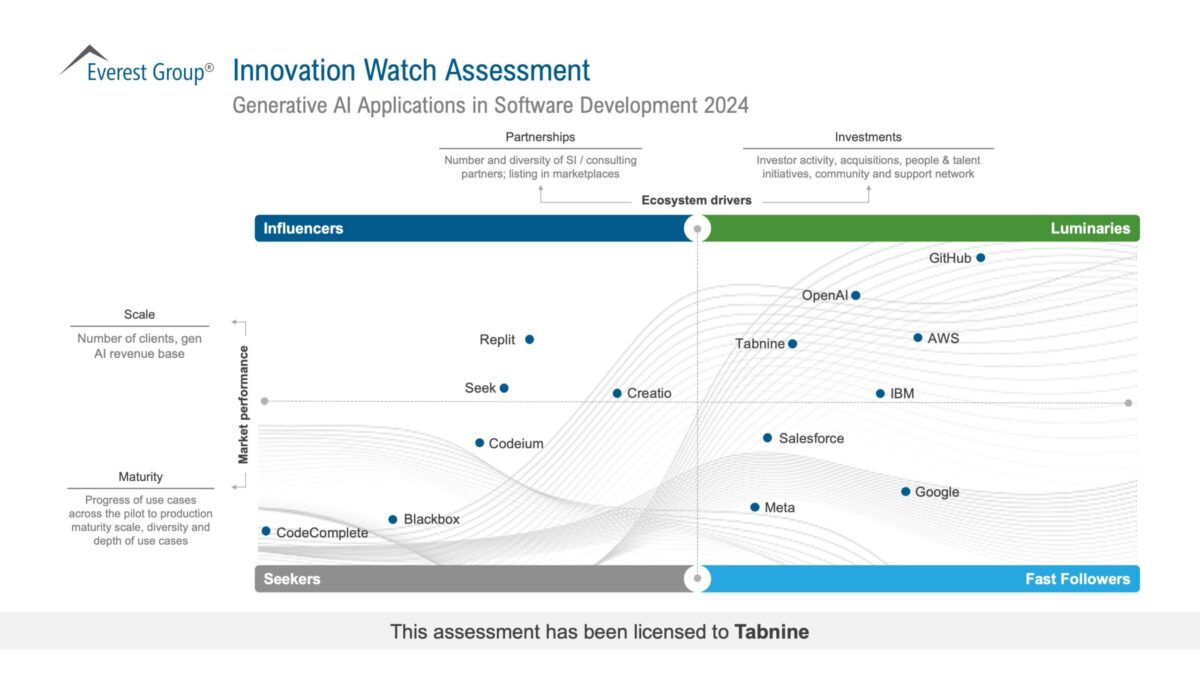
3. Tabnine AI-powered code completion and review
Tabnine offers highly customizable AI code completion that adapts to your team’s specific coding standards and private repositories. It provides inline suggestions that respect your existing patterns, reducing the cognitive load during routine coding tasks. Its review capabilities help catch logical errors early, ensuring consistency and quality across your entire codebase without disrupting your flow.
4. Sourcegraph Cody semantic code search debugging
Sourcegraph Cody leverages semantic search to help you understand and fix bugs across massive, complex codebases. Instead of simple text matching, it understands the intent behind your queries, pinpointing related functions and dependencies that might be causing issues. This deep contextual awareness makes it invaluable for debugging legacy systems or large-scale enterprise applications.
5. Replit AI agent for automated error resolution
Replit’s AI agent acts as a collaborative partner, automatically detecting runtime errors and suggesting comprehensive fixes within its cloud-based IDE. It can run code, identify stack traces, and propose solutions in real-time, significantly reducing the time spent on troubleshooting. This seamless integration of development and debugging environments accelerates the iteration cycle for rapid prototyping and deployment.
How AI changes code review workflows
AI debugging tools are shifting code review from a manual syntax check to an architectural audit. Instead of staring at a terminal to find a missing semicolon or a variable scope error, developers can offload the tedious detection work to automated agents. These tools scan your pull requests in real time, identifying logical inconsistencies, race conditions, and performance bottlenecks that human reviewers often miss due to fatigue or context switching.
This shift allows senior engineers to focus on system design and business logic rather than catching typos. For instance, tools like SonarQube with AI plugins or GitHub Copilot Enterprise can analyze code patterns across the entire repository, not just the diff. They flag potential security vulnerabilities or deprecated API usage before the code ever reaches a human reviewer. This proactive approach reduces the "ping-pong" effect of back-and-forth comments, speeding up the merge process significantly.
The result is a cleaner, more reliable codebase. By automating the detection of low-level errors, AI ensures that human attention is reserved for high-value decisions. You stop reviewing for syntax and start reviewing for substance. This change doesn't replace the developer; it elevates the role from code inspector to system architect.
Choosing the right debugging tool for your stack
There is no single tool that fixes every bug in every language. Picking the wrong one means fighting the interface instead of fixing the code. Match your tool to your primary language, your IDE habits, and how many people are pushing code.
Python and Data Science AI-powered assistants like Cursor or GitHub Copilot integrate directly into VS Code or PyCharm. They excel at spotting type errors and suggesting fixes for complex logic. If your team lives in Jupyter notebooks, look for tools that support inline cell debugging.
JavaScript and TypeScript VS Code remains the standard. Most modern AI debugging extensions here focus on auto-fixing linting errors and suggesting React hook corrections. If you work in a large monorepo, choose a tool that understands your workspace structure, not just single files.
Java and C++ These languages often require deeper stack tracing. Tools like IntelliJ IDEA’s debugger or Visual Studio’s native debugger are essential. AI features here should help parse massive stack traces, not just rewrite syntax. If you are debugging memory leaks, ensure the tool integrates with profilers.
Team Size Matters Solo developers can afford experimental tools. Teams of ten or more need stability. Ensure the tool offers consistent results across different machines and integrates with your CI/CD pipeline. A tool that breaks the build is worse than no tool at all.
Frequently asked questions about AI debugging
Is VS Code a debugging tool?
Yes, Visual Studio Code is a robust debugging tool. It comes with built-in support for JavaScript, TypeScript, and Node.js, allowing you to set breakpoints and inspect variables directly in the editor. For other languages, the Visual Studio Marketplace offers a wide variety of extensions that add debugging support for different runtimes, making it a versatile hub for AI-assisted code review and fix automation.
What are the four core debugging techniques?
Research by Lawrance et al. identifies four key phases in professional debugging: observing the failure, locating the fault, fixing the fault, and verifying the fix. AI debugging tools streamline this workflow by automating the observation and location steps through code analysis, while also suggesting fixes that you can verify with a single click.
How do AI debugging tools differ from traditional IDE debuggers?
Traditional debuggers let you step through code line by line, but AI tools analyze the entire codebase to predict errors before they happen. They use machine learning to spot patterns in your code, offering proactive suggestions for refactoring and bug prevention rather than just reactive error reporting.
Hardware That Supports AI Debugging
Software tools are only as good as the hands that wield them. When you are hunting for race conditions or staring down a complex stack trace, your physical setup matters more than you might think. The right hardware reduces friction, letting your AI debugging assistant focus on code while you focus on clarity.
A high-resolution monitor is non-negotiable. Splitting your screen between the IDE, the terminal, and the AI chat interface requires real estate. Vertical monitors are particularly useful for reading long logs or code reviews without constant scrolling. Pair this with a mechanical keyboard that has tactile feedback; the physical confirmation of every keystroke helps maintain flow state during deep debugging sessions.
Don't overlook audio. A good pair of noise-canceling headphones blocks out office chatter, allowing you to concentrate on the subtle cues from your debugging tools. If you work with voice-to-code AI assistants, a high-quality USB microphone ensures your commands are parsed correctly, reducing the back-and-forth friction.


As an Amazon Associate, we may earn from qualifying purchases.

No comments yet. Be the first to share your thoughts!