
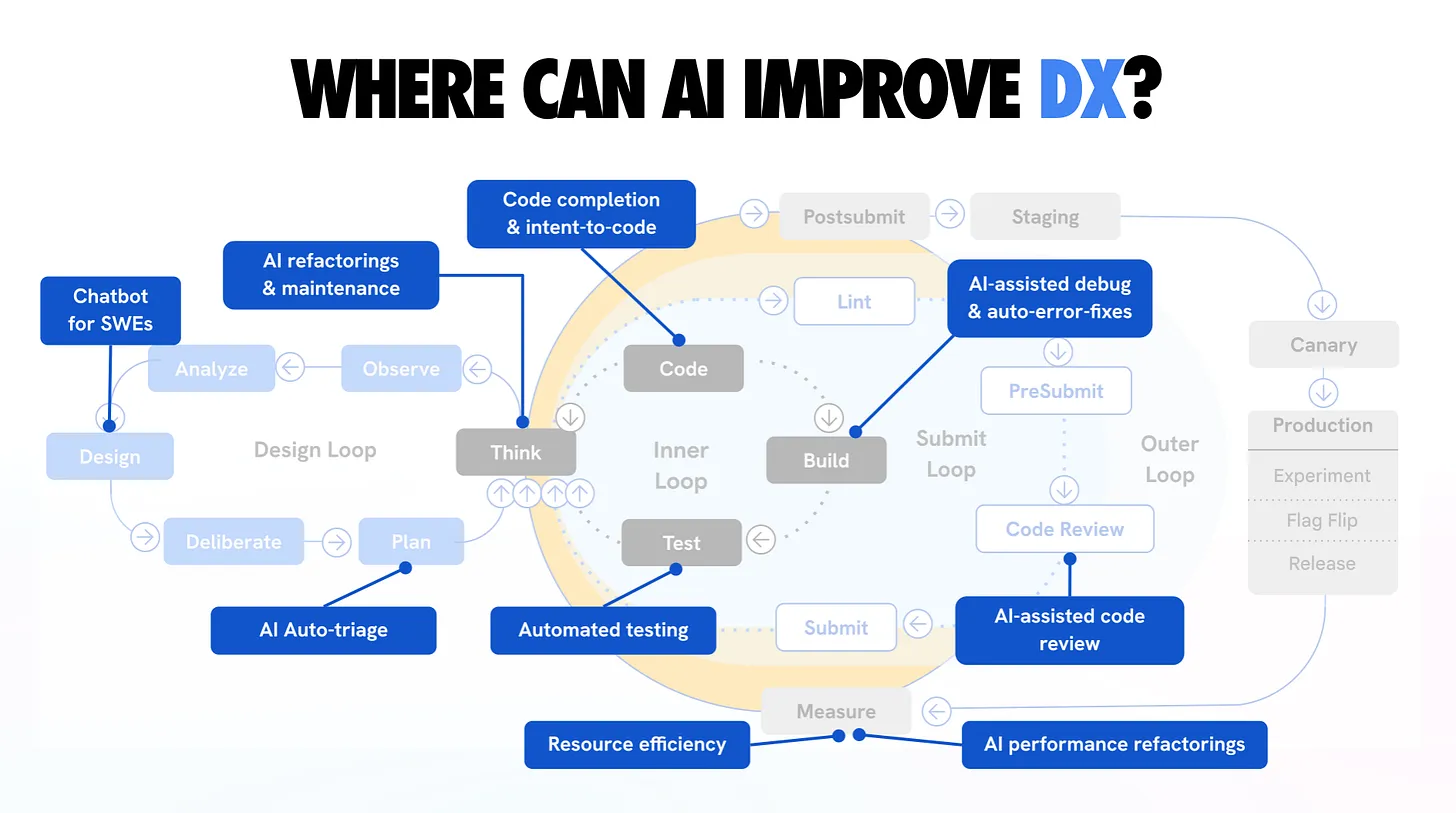
Why AI debugging tools matter now
Debugging has long been a manual, iterative process. Developers set breakpoints, inspect variables, and trace execution paths line by line. This traditional approach works for small scripts but becomes a bottleneck as codebases grow in complexity and microservices scale. The shift to AI-powered debugging tools marks a fundamental change from reactive error chasing to proactive root cause analysis.
AI debugging tools analyze code patterns, logs, and stack traces to identify the underlying cause of failures automatically. Instead of spending hours hunting for the missing semicolon or the race condition, these tools pinpoint the exact location and suggest a fix. This automation reduces the mean time to resolution (MTTR), allowing engineers to focus on building features rather than fixing broken ones.
The value of these tools extends beyond speed. They bring consistency to the debugging process, reducing human error and fatigue. By integrating directly into IDEs like Visual Studio Code or GitHub Copilot, they provide real-time assistance without interrupting the developer's workflow. As software systems become more distributed, the ability to instantly diagnose issues across multiple services is no longer a luxury—it is a necessity for maintaining productivity and system reliability.
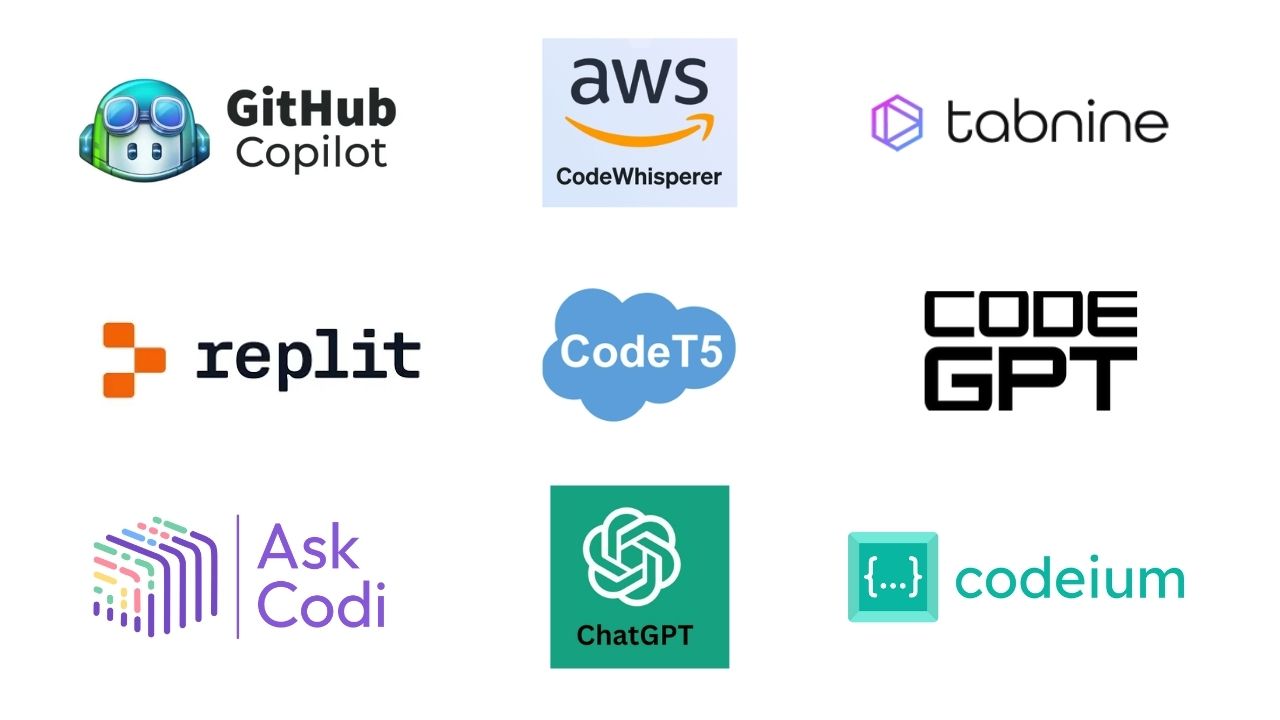
5 AI-Powered Debugging Tools to Automate Fixes in 2026
The 2026 debugging landscape demands tools that move beyond simple error detection to autonomous resolution. We evaluated leading solutions like Cursor, GitHub Copilot Workspace, and Amazon CodeWhisperer for their ability to automate fixes and perform deep root cause analysis. These specific AI-powered agents reduce manual intervention, allowing developers to restore system stability with minimal friction.
-
Amazon CodeWhisperer Real-Time Bug Detection
Amazon CodeWhisperer acts as a vigilant pair programmer, scanning your codebase for security vulnerabilities and logical errors as you type. Its real-time detection capabilities highlight issues immediately, allowing developers to address root causes before they propagate. By integrating directly into popular IDEs, it streamlines the debugging workflow, reducing the time spent on manual code reviews and minimizing the risk of deploying unstable software to production environments. -
GitHub Copilot Chat Root Cause Analysis
GitHub Copilot Chat transforms debugging by allowing developers to ask natural language questions about their code. When a bug arises, you can paste the error log or relevant code snippet, and Copilot analyzes the context to identify the root cause. This conversational interface provides detailed explanations and suggested fixes, turning a potentially frustrating debugging session into a guided learning experience that accelerates resolution without leaving your current workflow. -
JetBrains AI Assistant Automated Fix Suggestions
The JetBrains AI Assistant integrates seamlessly into the IntelliJ ecosystem, offering automated fix suggestions that understand the broader project context. When it detects an issue, it proposes precise code corrections that align with your existing architecture and coding standards. This contextual awareness ensures that fixes are not just syntactically correct but also semantically appropriate, significantly reducing the cognitive load on developers and speeding up the iteration cycle. -
Replit AI Code Correction Engine
Replit’s AI Code Correction Engine operates within its collaborative browser-based IDE, providing instant feedback and auto-corrections for syntax and logic errors. As you type, the engine anticipates mistakes and suggests completions that maintain code integrity. This real-time assistance is particularly valuable for beginners or rapid prototyping, as it minimizes friction and allows developers to maintain flow state while ensuring the code remains functional and error-free throughout the development process. -
Tabnine Autonomous Code Remediation
Tabnine leverages local models to provide autonomous code remediation, ensuring that sensitive data never leaves your environment. It analyzes code patterns to predict and fix bugs before they are committed, offering a privacy-first approach to automated debugging. By focusing on local inference, Tabnine delivers low-latency suggestions that adapt to your team’s specific coding conventions, making it an ideal choice for enterprises requiring strict data governance alongside efficient bug resolution.

How AI tools streamline code reviews
Beyond catching crashes, AI-powered debugging tools significantly accelerate the code review process. By analyzing code patterns in real time, these tools identify potential bugs and style violations before a human reviewer ever sees the pull request. This shifts the focus from nitpicking syntax to evaluating architectural decisions and business logic.
Tools like Sentry and Instabug automate the triage of production errors. Instead of developers manually sifting through raw logs, AI clusters similar issues and suggests root causes. This reduces the cognitive load on engineers and ensures that critical issues are addressed first. The result is a cleaner codebase with fewer regressions and faster deployment cycles.
| Tool | AI Accuracy | IDE Integration | Cost Model |
|---|---|---|---|
| Sentry | High | VS Code, JetBrains | Usage-based |
| Instabug | High | Mobile SDKs | Per MAU |
| VS Code | N/A | Native | Free |
| Chrome DevTools | N/A | Browser | Free |
| ReSharper | Medium | Visual Studio | Subscription |
Choosing the right debugging tool for your stack
Selecting an AI debugging tool requires matching specific capabilities to your technical environment. Start by verifying language support. Modern AI agents integrate best with ecosystems like Python, JavaScript, and TypeScript, where they can parse abstract syntax trees to suggest context-aware fixes. If your stack relies on lower-level languages like C or C++, you may need tools that bridge the gap between high-level AI reasoning and low-level memory management, such as those integrating with WinDbg or GDB.
Team size and data privacy are equally critical. Solo developers often prioritize speed and IDE integration, favoring tools that live directly inside VS Code or JetBrains environments. Larger teams, however, must evaluate how AI tools handle codebase visibility. If your code contains proprietary logic, ensure the tool offers local processing or strict data retention policies. Automated root cause analysis is only valuable if it doesn't expose sensitive source code to third-party servers.
- Language Support: Ensure the tool natively understands your primary stack (e.g., Python, JS, Go).
- Privacy Policy: Verify if code is sent to external LLMs or processed locally.
- IDE Compatibility: Check for seamless integration with your existing editor.
- Pricing Model: Determine if the cost scales with team size or usage volume.
Frequently asked questions about AI debugging
Is VS Code a debugging tool?
Visual Studio Code is not a standalone debugger but an editor with deep debugging integration. It includes built-in support for JavaScript, TypeScript, and Node.js. For other languages, you install extensions like GitHub Copilot to enable AI-powered root cause analysis and automated fixes.
Can AI tools fix code automatically?
Yes. Tools like GitHub Copilot and Cursor can identify syntax errors and logic bugs. They generate patch suggestions that you can review and apply with one click. This automation reduces the time spent on repetitive refactoring tasks.
Do AI debuggers work for legacy code?
AI assistants struggle with unstructured legacy codebases lacking documentation. They perform best in modern environments with clear type definitions. For older systems, use AI for unit test generation first to establish a safety net before attempting automatic fixes.
Helpful gear
Use these product recommendations as a starting point, then choose the size, material, and price point that fit how you actually use the gear.

As an Amazon Associate, we may earn from qualifying purchases.

No comments yet. Be the first to share your thoughts!