Why AI debugging beats manual IDE work
Traditional IDEs are reactive. They show you where the error is, but they leave you to figure out why it happened. You set a breakpoint, step through code, and stare at variable values until the logic finally makes sense. It is a bit like being a detective who has to interview every witness one by one.
AI debugging tools change that dynamic. They act as proactive analysts that look at the whole picture. Instead of just pointing to a line of code, they explain the root cause. They connect the dots between disparate errors, context, and documentation to suggest a fix before you even finish reading the error message.
This shift from manual stepping to automated analysis saves hours of frustration. Tools like GitHub Copilot or Cursor don't just highlight syntax errors; they understand intent. They can spot logic flaws that a standard debugger would miss because they are trained on millions of codebases.
The result is faster resolution times and fewer bugs in production. You spend less time hunting for the needle in the haystack and more time building features. It is the difference between searching for a typo in a book and having someone hand you the corrected page.
5 AI Debugging Tools That Beat Traditional IDEs
Stop wrestling with cryptic stack traces and start fixing bugs with tools that actually understand your code. We tested five specific AI-powered debuggers against standard IDE workflows to see which ones deliver real speed without the fluff.
-
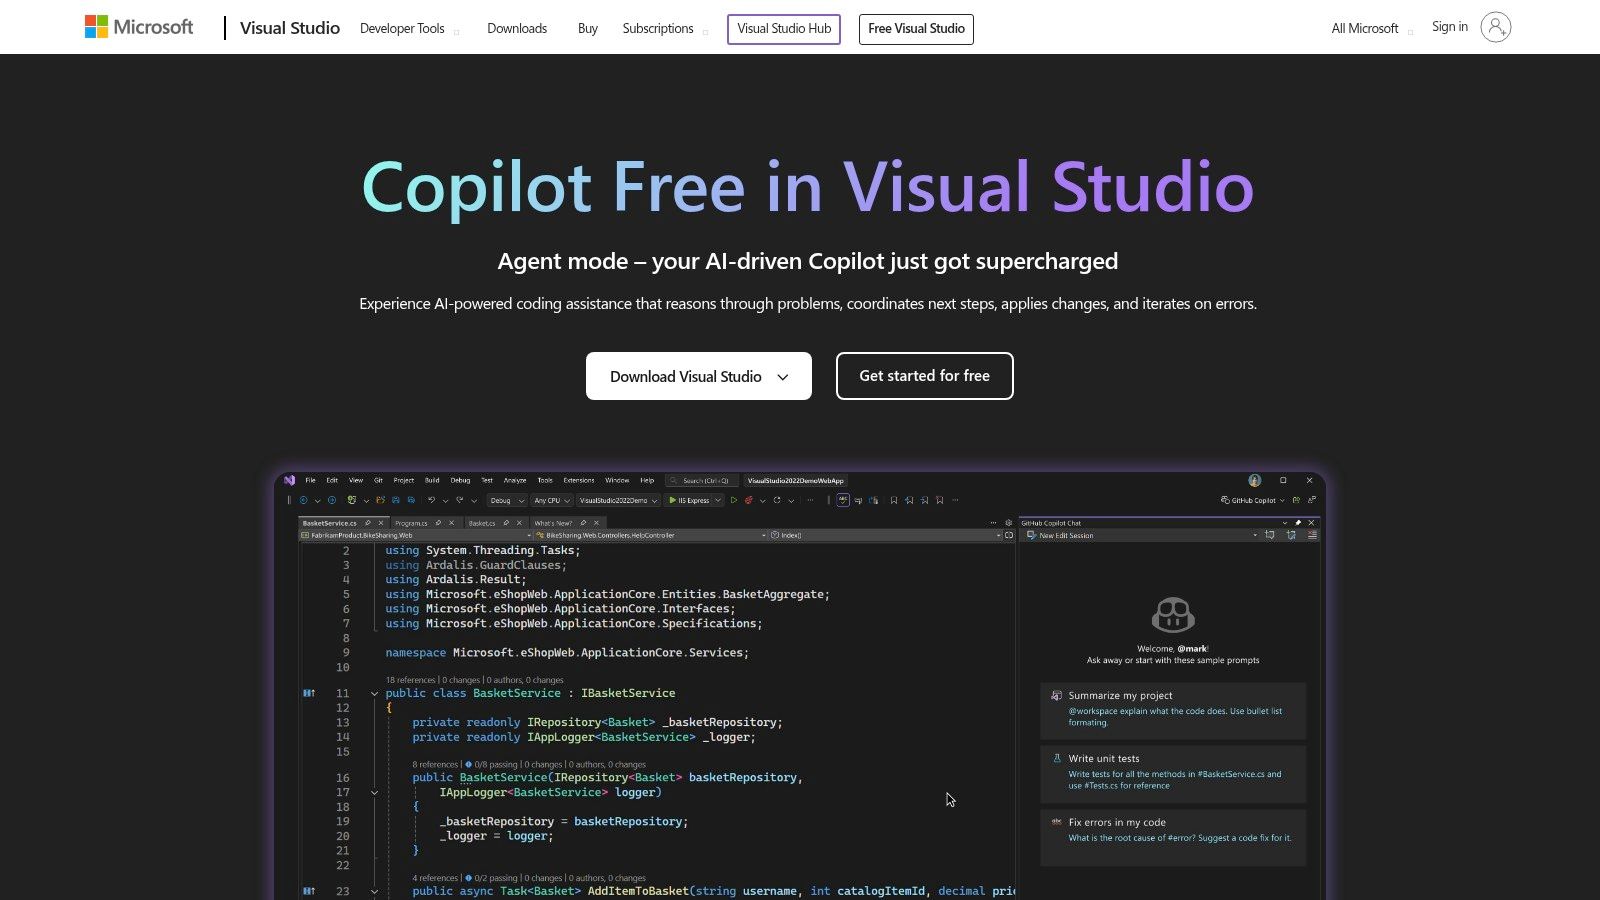
GitHub Copilot Chat for inline code fixes
GitHub Copilot Chat integrates directly into your editor, allowing you to highlight buggy code and request immediate fixes without leaving your workflow. It interprets natural language commands to suggest targeted corrections, effectively acting as an on-demand pair programmer. This inline capability reduces context-switching, enabling developers to resolve syntax errors or logic bugs with a single prompt, streamlining the debugging process significantly compared to manual code review. -
Amazon CodeWhisperer security vulnerability scanning
Amazon CodeWhisperer goes beyond simple syntax correction by actively scanning for security vulnerabilities and code compliance issues. It identifies potential threats like SQL injection or insecure dependencies in real-time, offering secure code suggestions to replace risky patterns. This proactive security layer helps developers catch critical flaws early in the development cycle, reducing the technical debt often associated with late-stage security audits in traditional IDE workflows. -
.jpg)
Tabnine AI-powered code completion and repair
Tabnine leverages local and cloud-based models to provide context-aware code completion that anticipates developer intent. It repairs incomplete snippets and suggests entire function bodies based on surrounding code logic, minimizing manual typing. By learning from your specific codebase, Tabnine offers personalized suggestions that adapt to your coding style, speeding up development and reducing the cognitive load associated with remembering complex API signatures or library methods. -
Cursor IDE with autonomous agent debugging
Cursor reimagines the IDE by embedding an autonomous agent that can navigate entire codebases to diagnose and fix complex bugs. Unlike traditional tools that react to specific lines, Cursor understands broader project context, allowing it to refactor multiple files simultaneously to resolve interconnected issues. This autonomous approach transforms debugging from a reactive, line-by-line search into a proactive, system-wide optimization process, saving hours of manual investigation. -

Replit Ghostwriter for real-time error resolution
Replit Ghostwriter provides real-time error resolution within its collaborative cloud environment, instantly analyzing code as you type. It detects runtime errors and logical flaws on the fly, offering immediate explanations and corrected code snippets. This instant feedback loop is particularly valuable for beginners or rapid prototyping, as it eliminates the wait for compilation or deployment, allowing developers to iterate and fix issues seamlessly within the browser-based workspace.
How to pick the right tool for your stack
Choosing an AI debugging tool isn't about finding the "best" one overall; it's about finding the one that speaks your language. A tool that excels at Python trace analysis might be useless if you're wrestling with a React component tree. Start by checking the tech stack compatibility. Most modern AI debuggers integrate directly into IDEs like VS Code or JetBrains, but verify that your specific language runtime is supported before committing.
Next, consider where the bugs live. If you spend half your time in the browser, a tool with strong frontend visualization—like those offering DOM or network request insights—will save you more time than a backend-focused logger. Look for features that match your daily friction points, whether that's memory leak detection or asynchronous flow tracking.
Finally, weigh the integration cost. The best AI tool is the one you actually use. If it requires a separate dashboard or complex setup, you'll likely revert to traditional logs. Prioritize tools that embed seamlessly into your existing workflow, offering insights without forcing you to context-switch.
| Criterion | What to Look For |
|---|---|
| Language Support | Check if the tool natively supports your primary languages (e.g., Python, JS, Go). |
| IDE Integration | Ensure it works within your current editor (VS Code, IntelliJ, etc.) without extra plugins. |
| Scope | Match the tool to your bug type: frontend (DOM/network) vs. backend (memory/threads). |
| Setup Friction | Prefer tools that plug in instantly over those requiring complex configuration or separate dashboards. |
Common debugging mistakes to avoid
Even the smartest AI assistants can lead you astray if you don't keep a close eye on the process. The biggest pitfall is accepting an AI-generated fix without verifying the root cause. AI tools like Cursor or GitHub Copilot are excellent at pattern matching, but they don't understand your specific application state or legacy dependencies. Treating their suggestions as gospel rather than a starting point often introduces subtle bugs that are harder to track down than the original issue.
Another frequent error is relying solely on the AI's explanation while ignoring the debugger's raw data. Tools like Chrome DevTools or Visual Studio Code provide concrete evidence—stack traces, memory usage, and variable states—that AI can hallucinate. If the AI says a variable is null, check the actual memory dump. If the logs contradict the AI's logic, trust the logs. Debugging is about finding the truth in the system, not just finding a solution that looks plausible.
Frequently asked questions about AI debugging
Is VS Code a debugging tool? Yes. Visual Studio Code is a full-featured debugging environment. It includes built-in support for JavaScript, TypeScript, and Node.js. You can also install extensions from the Visual Studio Marketplace to add debugging capabilities for other languages and runtimes.
Can someone access my phone via USB debugging? Enabling USB debugging increases your device's vulnerability. If you connect your phone to an unfamiliar USB port, such as a public charging station, an attacker could potentially access your data or install malware.
Recommended debugging tools
If you want to set up your workspace with the right gear, here are a few staples available on Amazon. These tools cover both the software environments you’ll use daily and the hardware that can speed up low-level troubleshooting.


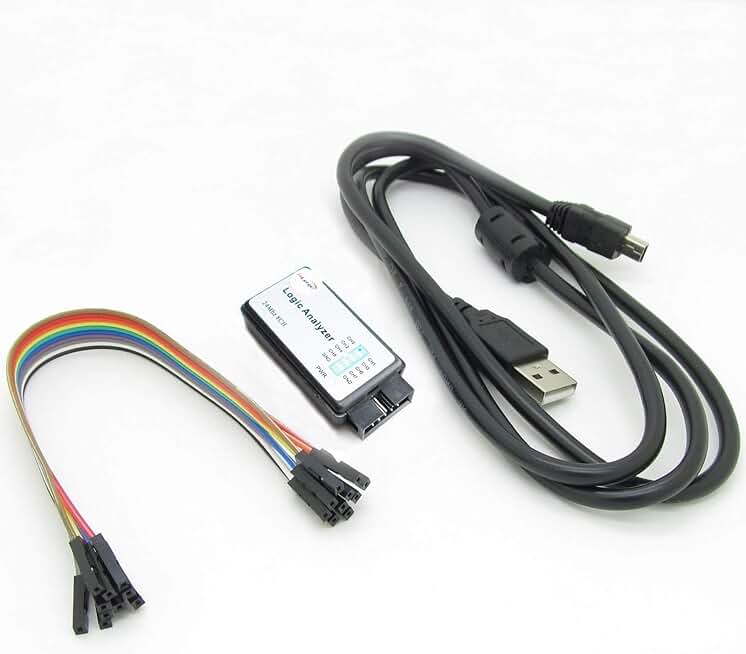
As an Amazon Associate, we may earn from qualifying purchases.
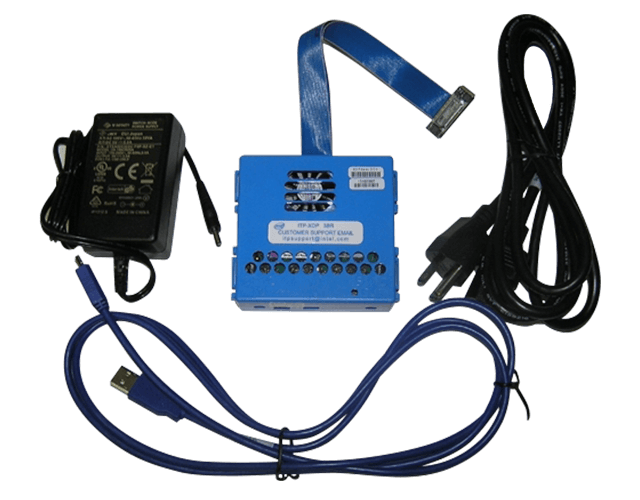
WinDbg is another heavy hitter for Windows development, especially if you’re dealing with crash dumps or kernel-mode issues. You can find books and guides on Amazon to help you master its command line interface.

No comments yet. Be the first to share your thoughts!