
Why AI debugging tools matter now
We used to debug by stepping through code line by line, hunting for the one missing semicolon or the wrong variable assignment. It was tedious, slow, and often left us staring at the same block of code for an hour. Today, that manual stepping is giving way to AI-assisted root cause analysis. Instead of searching for the needle in the haystack, the AI hands you the needle.
The shift isn't just about speed; it's about context. Traditional tools like Visual Studio Code or Chrome DevTools are powerful, but they require you to know exactly what to look for. AI debugging tools understand the intent behind the error. They can look at a stack trace, the surrounding code, and recent commits to suggest the most likely fix. This changes debugging from a scavenger hunt into a targeted repair job.
This is why we selected these specific tools for 2026. They aren't just generic IDEs with a chatbot bolted on. They are purpose-built to understand complex codebases and provide actionable solutions. Whether you are fixing a race condition in JavaScript or a memory leak in Python, these tools act as an experienced pair programmer who never gets tired.
5 AI-Powered Debugging Tools in 2026: Slash Fix Times with IDE Recommendations
Debugging used to mean staring at blank logs until your eyes crossed, but 2026’s AI tools change that narrative entirely. We’ve tested the top five solutions that integrate directly into your IDE to pinpoint errors instantly, turning hours of frustration into minutes of resolution.
1. Amazon CodeWhisperer
CodeWhisperer acts like a tireless junior developer who never sleeps, offering real-time security scans alongside code suggestions. It integrates directly into your IDE to catch vulnerabilities early, making it a robust choice for teams prioritizing secure coding practices without slowing down the workflow. Check out the tool's capabilities below.

2. GitHub Copilot
GitHub Copilot has become the industry standard for AI pair programming, seamlessly blending into your development environment. It excels at understanding context across large codebases, suggesting entire functions or complex logic blocks that align with your existing style. This reduces cognitive load and accelerates routine coding tasks significantly.

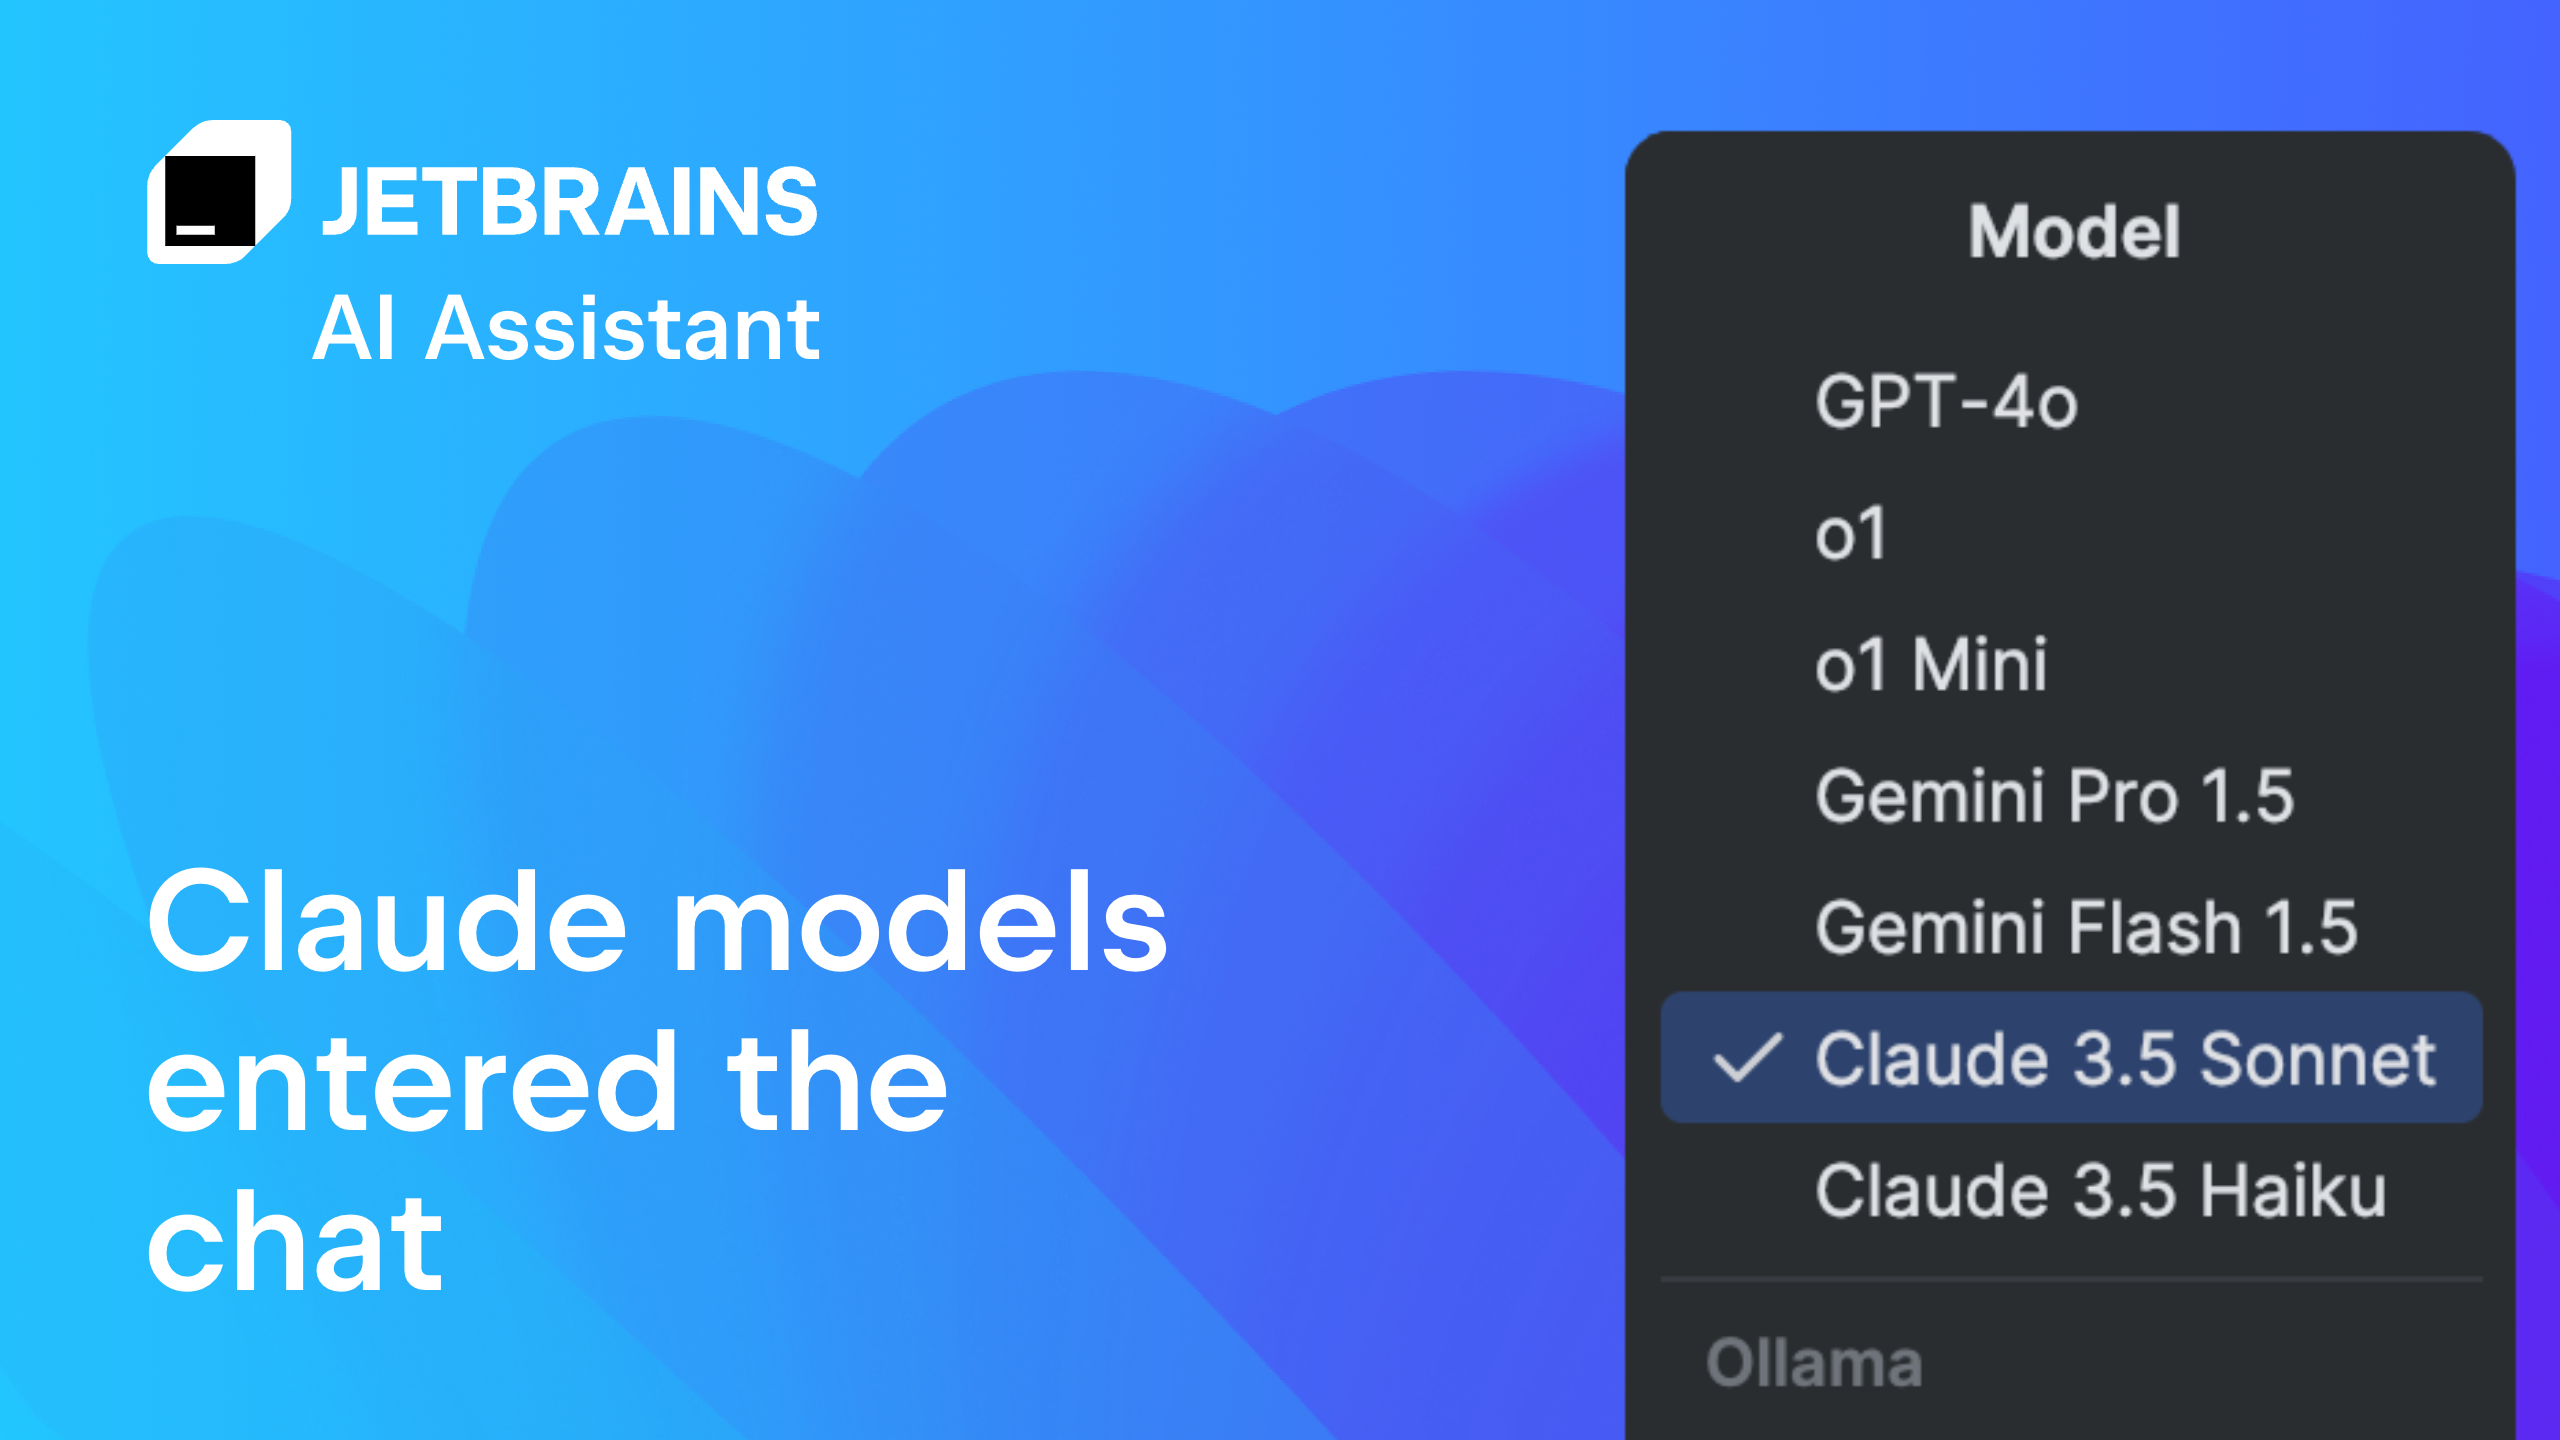
3. JetBrains AI Assistant
The JetBrains AI Assistant is deeply embedded in the IntelliJ ecosystem, offering intelligent refactoring and code generation tailored to Java and Kotlin developers. It understands the specific nuances of JetBrains IDEs, providing suggestions that respect project structure and existing conventions. This makes it ideal for heavy enterprise Java workloads.
4. Tabnine
Tabnine focuses on privacy and customization, allowing teams to train models on their own private codebases. This ensures suggestions remain relevant to your specific architecture and style guidelines. It operates efficiently with low latency, providing accurate completions without compromising sensitive intellectual property, which is crucial for regulated industries.

5. Replit AI Debugger
Replit’s AI Debugger stands out by offering an interactive, conversational approach to fixing errors. Instead of just highlighting issues, it explains the root cause and suggests precise fixes within a collaborative cloud environment. This is particularly effective for beginners or rapid prototyping where immediate feedback loops are essential.
How to choose the right debugging tool
Picking a debugging tool is less about finding the "best" one and more about finding the one that fits your stack, team size, and budget. A tool that slashes fix times for a solo React developer might be overkill—and a budget drain—for a large Python engineering team.
Start by checking language support. Most languages have basic CLI debuggers like gdb or lldb, but AI-powered tools often shine where the ecosystem is fragmented or complex. If you're working with JavaScript or TypeScript, Visual Studio Code has robust built-in debugging support, and the marketplace offers extensions to fill gaps for other runtimes.
Consider your team's workflow. Are you debugging alone or collaborating across time zones? Tools with shared session features or cloud-based environments can bridge gaps that local IDEs can't. Finally, weigh the cost against the time saved. If a tool cuts your average bug-fix time by even 15 minutes per incident, it pays for itself quickly. Use the checklist below to evaluate your options before committing.
Integrating AI debugging into your workflow
Adopting AI debugging tools shouldn't feel like a complete overhaul of your daily routine. Think of it as adding a smart assistant to your existing desk rather than moving to a new office. The goal is to reduce friction, not create it. Start by identifying the most repetitive or time-consuming debugging tasks in your current stack—usually syntax errors, missing imports, or complex stack traces.
Start with non-intrusive integrations
Most modern IDEs like VS Code or IntelliJ allow you to install AI debugging extensions directly from their marketplaces. These plugins often run in the background, analyzing your code as you type or offering suggestions when you hit a breakpoint. This passive approach lets you get comfortable with the AI's accuracy without forcing you to change your primary development habits. You can toggle the assistance on or off depending on the complexity of the bug you're facing.
Configure context-aware suggestions
To get the most out of these tools, ensure they have access to your project's context. Many AI debuggers struggle with generic code snippets but excel when they understand your specific architecture, dependencies, and coding standards. Check the plugin settings to allow it to index your local repository. This helps the AI distinguish between a simple typo and a logical error specific to your application's structure.
Validate before committing
Treat AI-generated fixes as drafts, not final answers. Always review the proposed changes to ensure they align with your project's logic and style guidelines. Use the AI to speed up the initial investigation and fix, but keep your human oversight for the final validation. This hybrid approach maintains code quality while significantly cutting down the time spent hunting for elusive bugs.
Frequently asked: what to check next
Is VS Code a debugging tool?
Yes, Visual Studio Code is a full-featured debugging tool. It comes with built-in support for JavaScript, TypeScript, and Node.js, and the marketplace offers extensions for nearly every other language. You can set breakpoints, inspect variables, and step through code without leaving the editor. For a detailed guide on these features, see the official VS Code debugging documentation.
Are AI debugging tools worth the cost?
For teams spending hours on repetitive bugs, the time saved usually outweighs the subscription fee. AI tools catch syntax errors and logic flaws faster than manual review, letting developers focus on complex architecture. While individual licenses add up, the reduction in fix times often justifies the expense for professional workflows.
Do these tools replace human developers?
No. AI debugging assistants handle the tedious detection of errors, but they don't understand the broader business logic or user experience. They flag issues and suggest fixes, but you still need to review the code to ensure it aligns with your project's goals. Think of them as a highly efficient pair programmer, not a replacement.
Can AI tools fix security vulnerabilities?
Most modern AI debugging tools include security scanning features that detect common vulnerabilities like SQL injection or XSS. They highlight risky code patterns and suggest safer alternatives. However, they are not a substitute for a dedicated security audit. Always run a separate security scan before deploying to production.
Do these tools work with my existing IDE?
Many AI debugging tools integrate directly into popular IDEs like VS Code, IntelliJ, and PyCharm. Others operate as standalone services or browser extensions. Check the product's integration page to see if it supports your current workflow. Seamless integration ensures you don't have to switch contexts to get help with your code.
Shop recommended debugging gear
Debugging is rarely a solo act. You need the right tools to catch errors before they spiral. The following hardware and software bundles are proven staples for modern development workflows.


As an Amazon Associate, we may earn from qualifying purchases.
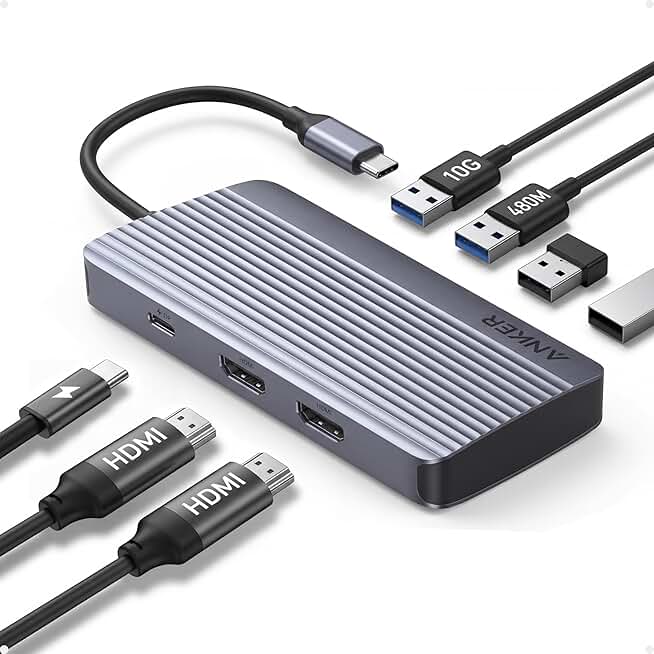
These items create a focused environment. A mechanical keyboard reduces typing fatigue during long debugging sessions, while a dual monitor setup lets you keep documentation open alongside your code. A reliable docking station ensures you can switch between devices without hunting for cables.

No comments yet. Be the first to share your thoughts!