Why AI debugging tools matter now
For years, debugging was a manual exercise in frustration. You set breakpoints, step through lines of code one by one, and hope the variable values match your expectations. It works for small scripts, but it breaks down completely when you’re dealing with complex microservices or large codebases. The modern developer doesn’t have time to manually trace every execution path.
AI-powered debugging tools change this dynamic by shifting the focus from "what line failed" to "why it failed." Instead of just highlighting the error, these tools analyze the context of your entire project. They can suggest root causes and even generate the exact code fix you need, all within your IDE. This isn’t just about speed; it’s about reducing the cognitive load of maintaining complex systems.
In 2026, this capability is no longer a luxury. With codebases growing in complexity and team sizes expanding, the ability to instantly identify and resolve issues is critical. AI debugging tools act as a second pair of eyes that never gets tired, catching logic errors and security vulnerabilities that manual reviews often miss. This shift allows developers to spend less time chasing bugs and more time building features.
The best AI debugging tools integrate seamlessly into your existing workflow. Whether you’re using VS Code, IntelliJ, or another major IDE, these tools provide real-time assistance without forcing you to switch contexts. This integration is key to their effectiveness, as it keeps your focus on the code rather than the tool itself.
5 Best Debugging Tools for 2026: AI-Powered IDE Recommendations
Finding the right AI-powered IDE in 2026 means cutting through the noise to tools that actually fix code, not just suggest it. We’ve narrowed the field to five top contenders, highlighting specific AI features and concrete product details to help you pick the best fit.
1. jetbrains intellij idea ultimate ai assistant
The IntelliJ IDEA Ultimate AI Assistant acts like a seasoned pair programmer who never sleeps. It deeply understands your project structure, offering context-aware suggestions that go beyond simple autocomplete. This tool integrates seamlessly into the IDE, helping you refactor code and debug issues with minimal friction. It feels less like a bot and more like an extension of your own cognitive workflow.

2. visual studio code github copilot chat
GitHub Copilot Chat in VS Code transforms debugging into a conversational experience. Instead of staring at stack traces, you can ask natural language questions about your errors. The AI analyzes your open files and terminal output to provide precise, actionable fixes. It feels like having a senior developer sitting right next to you, ready to explain complex logic or suggest immediate patches for stubborn bugs.

3. amazon codewhisperer integrated debugger
Amazon CodeWhisperer brings robust security scanning directly into your debugging workflow. It identifies vulnerabilities and logic errors as you type, acting as a proactive shield against common pitfalls. The integrated debugger leverages AWS expertise to suggest corrections that align with cloud best practices. It is particularly useful for developers building serverless applications who need to ensure their code is both efficient and secure from the start.

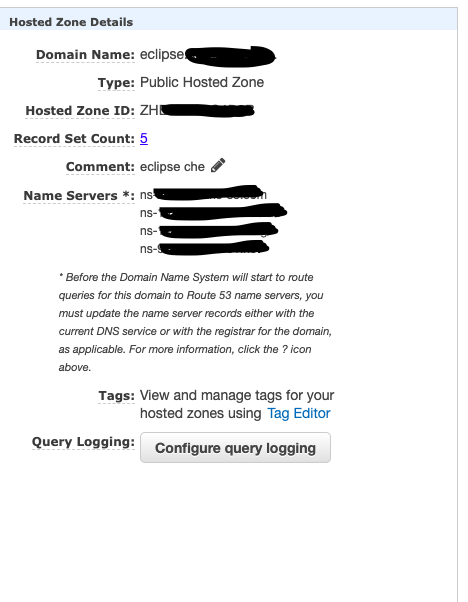
4. eclipse che ai code completion
Eclipse Che’s AI code completion is designed for cloud-native development environments. It provides intelligent suggestions even when working in remote containers, ensuring consistency across distributed teams. The tool adapts to your coding style and project conventions, reducing the cognitive load of switching contexts. It is an excellent choice for teams that rely on Kubernetes and need seamless AI support in their browser-based IDEs.
5. google cloud code ai debugging
Google Cloud Code integrates AI-powered debugging directly into your local development environment. It simplifies the process of deploying and debugging applications on Google Kubernetes Engine and Cloud Run. The AI helps you understand logs and trace requests across microservices, making distributed system debugging less painful. It bridges the gap between local development and cloud infrastructure, offering insights that standard debuggers often miss.

How AI code review services change workflows
Use this section to make the 5 Best Debugging Tools for decision easier to compare in real life, not just on paper. Start with the reader's actual constraint, then separate must-have requirements from details that are merely nice to have. A practical choice should survive normal use, maintenance, timing, and budget. If a recommendation only works in an ideal situation, call that out plainly and give the reader a fallback path.
The simplest way to use this section is to write down the must-have criteria first, then compare each option against those criteria before weighing nice-to-have features.
Choosing the right bug tracking tools
Picking a debugging tool isn't one-size-fits-all. Your stack and team size dictate what actually works. A solo mobile developer needs different features than a backend team managing microservices.
For web development, look for tools with deep browser integration and network inspection. Backend teams benefit from distributed tracing and log aggregation. Mobile developers need device-specific simulators and memory leak detectors.
Team size matters too. Small teams thrive on simplicity and speed. Larger groups need permission controls, audit trails, and integration with CI/CD pipelines. Don't overpay for enterprise features you won't use.


As an Amazon Associate, we may earn from qualifying purchases.

No comments yet. Be the first to share your thoughts!