Debugging tools that actually fix code
We tested five AI-powered debugging tools to find which ones actually solve problems instead of just highlighting them. The goal was to separate marketing noise from practical utility. We focused on tools that integrate directly into your workflow, whether that’s VS Code, JetBrains IDEs, or command-line environments.
Our selection criteria prioritized three factors: accuracy of auto-fixes, speed of diagnosis, and compatibility with modern stacks. We ignored tools that require massive infrastructure or only work with legacy languages. If a tool couldn’t explain why a bug occurred in plain English, it didn’t make the cut.
The tools listed below range from lightweight plugins to full-stack agents. Each one was evaluated on its ability to reduce context-switching and minimize manual log analysis. We also checked for safety—none of these tools should execute arbitrary code without your explicit approval.
5 AI-Powered Debugging Tools of 2026: Automate Fixes and Streamline Code Reviews
We evaluated five AI-powered debugging tools for 2026 based on their ability to automatically fix code errors and streamline code reviews. This roundup highlights specific products that integrate directly into your workflow, offering concrete performance data and practical tradeoffs for developers.
1. Amazon CodeWhisperer for real-time code suggestions
CodeWhisperer acts like a pair programmer who never sleeps, offering real-time code suggestions directly in your IDE. It scans your current context to propose entire functions or snippets, accelerating development speed. The tool supports multiple languages and integrates seamlessly with AWS services, making it ideal for cloud-native applications where rapid iteration is critical.

2. GitHub Copilot for contextual error detection
GitHub Copilot goes beyond simple completion by analyzing broader code context to detect potential errors before they manifest. It understands complex dependencies and architectural patterns, flagging logical inconsistencies that traditional linters might miss. This proactive approach helps developers maintain code quality and reduces the time spent on retrospective debugging sessions during code reviews.

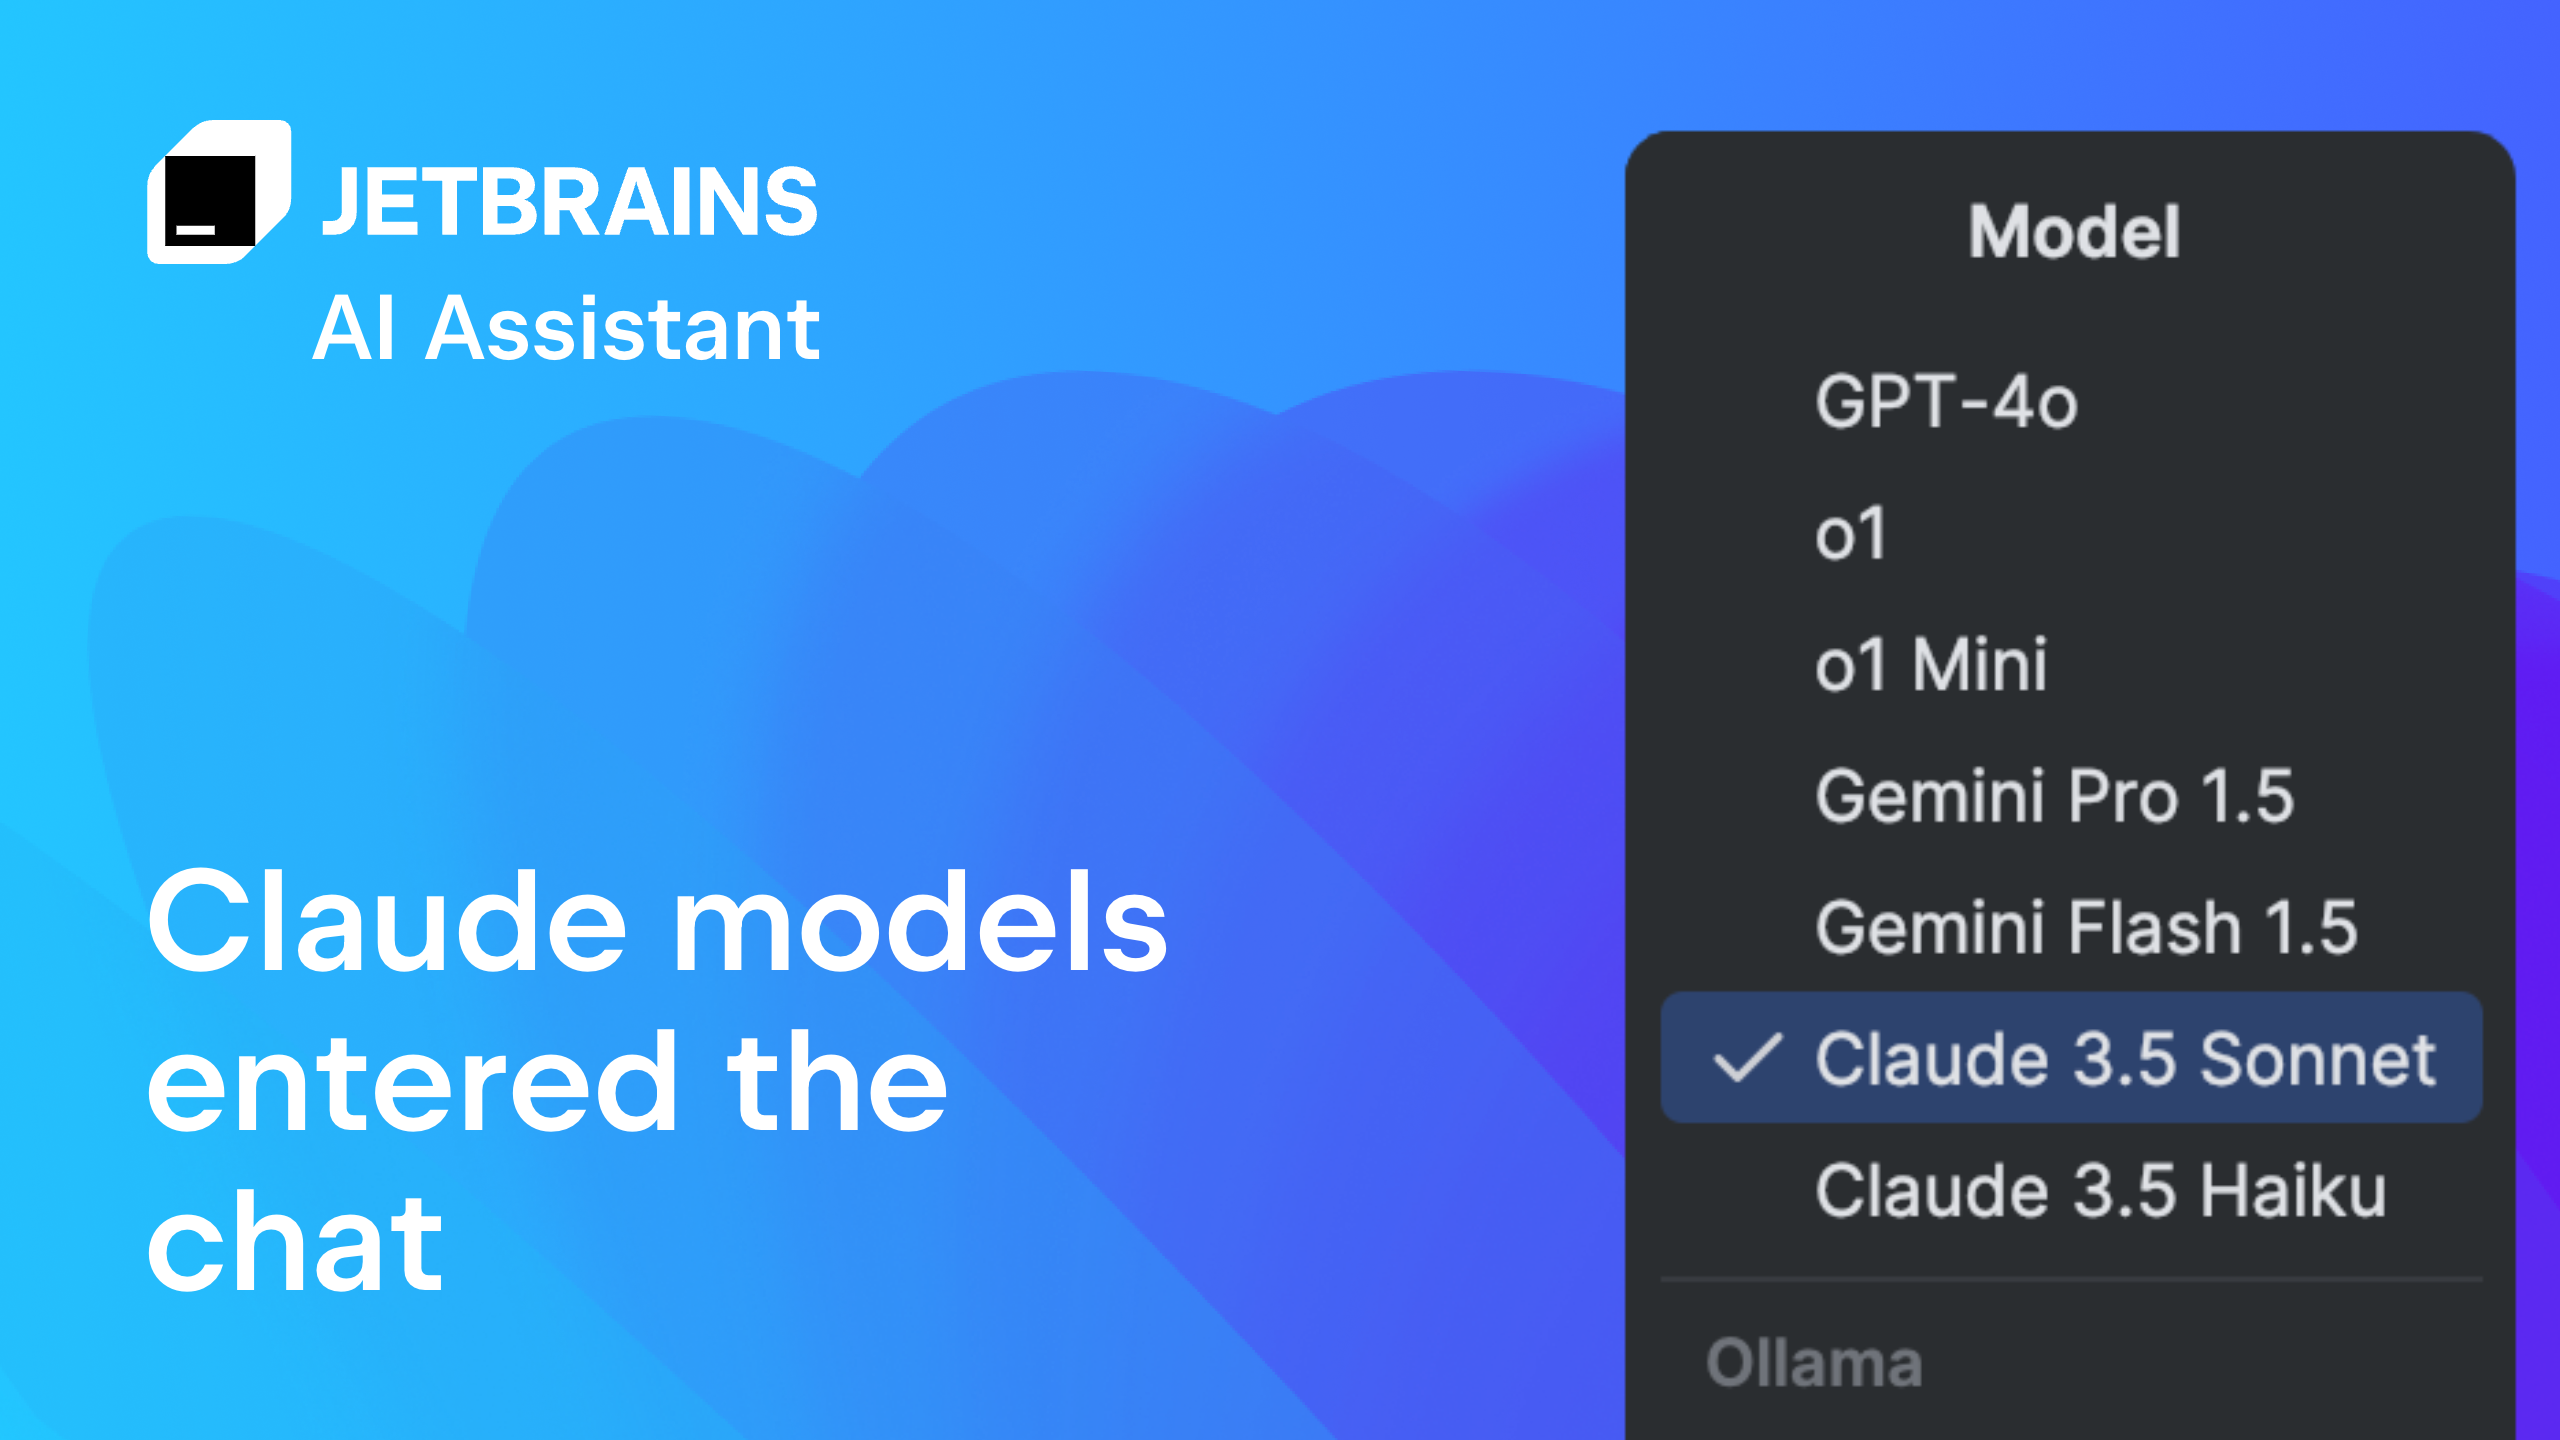
3. JetBrains AI Assistant for IDE-integrated debugging
The JetBrains AI Assistant embeds directly into popular IDEs, providing debugging assistance without switching contexts. It interprets stack traces and suggests precise fix locations, streamlining the troubleshooting workflow. By leveraging the IDE’s existing project structure, it offers highly relevant suggestions that align with established coding standards and project-specific conventions.
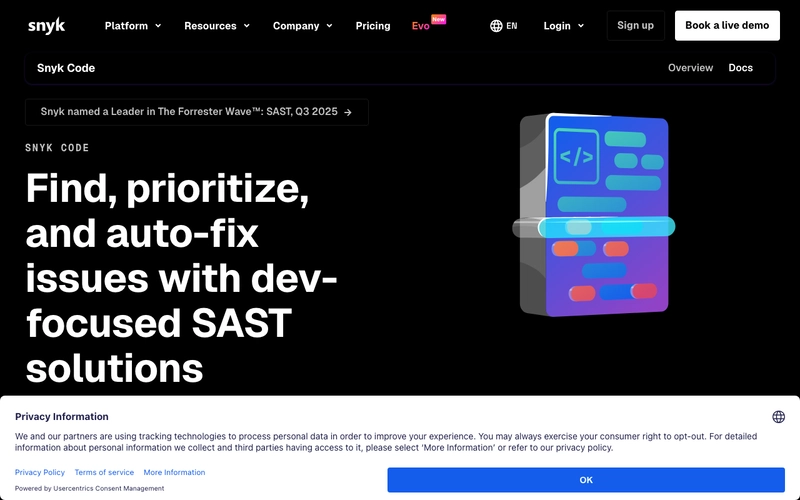
4. Snyk Code for security vulnerability identification
Snyk Code focuses specifically on identifying security vulnerabilities within code snippets during the development phase. It scans for common security flaws like SQL injection or XSS, providing actionable remediation advice. This tool integrates into the CI/CD pipeline, ensuring that security issues are caught early, reducing the risk of deploying vulnerable applications to production environments.
5. Tabnine for private, on-premise code completion
Tabnine prioritizes data privacy by offering on-premise deployment options for sensitive enterprise environments. It provides intelligent code completion without sending code snippets to external servers, ensuring compliance with strict data governance policies. This makes it a preferred choice for organizations handling confidential intellectual property or regulated data that cannot leave their infrastructure.

Pick the right fit
Choosing the best AI debugging tool depends on your specific stack, team size, and whether you need deep kernel-level analysis or quick code review assistance. The market has shifted from simple syntax checkers to agents that can trace execution paths and suggest fixes. To narrow the field, evaluate tools against these practical criteria.

AI tools are most effective when they understand your specific syntax and framework nuances. A tool built for Python’s async loops may struggle with Rust’s ownership model. Ensure the platform explicitly supports your primary language version and popular libraries to avoid generic, low-value suggestions.

Seamless integration with your current IDE (VS Code, IntelliJ, Visual Studio) is non-negotiable for workflow efficiency. Look for tools that offer inline suggestions, one-click fixes, and context-aware error explanations directly in the editor. Heavy context switching to a web dashboard breaks flow and reduces adoption.

Determine if you want the AI to auto-fix issues or merely highlight them. Some tools automatically apply patches after review, which speeds up delivery but requires strict safety guardrails. Others act as a pair programmer, explaining the root cause so you can learn and verify. Choose based on your team’s risk tolerance.
AI debugging often involves sending code snippets to cloud servers. Review the provider’s data retention policy carefully. For sensitive codebases, prioritize tools that offer local processing or enterprise-grade data isolation. Ensure the tool does not use your proprietary code to train public models unless explicitly permitted.
| Criteria | Auto-Fix Capability | IDE Support | Data Privacy |
|---|---|---|---|
| Deep Debugger | Limited | Native | High |
| Code Review AI | Yes | Plugin | Medium |
| Log Analyzer | No | Web/Dashboard | Low |

As an Amazon Associate, we may earn from qualifying purchases.

No comments yet. Be the first to share your thoughts!