
Choosing the right debugging tools
The debugging landscape in 2026 is defined by a shift from reactive error hunting to proactive code assistance. Developers no longer rely solely on stepping through code line-by-line; instead, they use a hybrid stack that combines traditional IDE-integrated debuggers with browser-based inspection tools and emerging AI assistants. This approach reduces context switching and allows for faster resolution of complex issues.
Traditional IDE debuggers remain the backbone of backend and desktop development. Tools like Visual Studio Code and PyCharm offer deep integration, allowing developers to set breakpoints, inspect variable states, and trace execution flow within the same environment where they write code. These tools provide the granular control necessary for understanding the internal mechanics of an application, making them indispensable for complex logic errors.
For frontend development, browser-based tools like Chrome DevTools have become essential. They allow developers to inspect the Document Object Model (DOM), monitor network requests, and analyze performance metrics in real-time. This visibility is critical for debugging UI rendering issues, JavaScript errors, and API failures that occur in the client environment.
The most significant change in 2026 is the integration of AI assistants. These tools analyze error stacks and code context to suggest fixes or explain complex bugs, effectively acting as a pair programmer. While AI accelerates the initial diagnosis, it still relies on the foundational data provided by traditional debuggers and browser tools. The most effective debugging strategy leverages all three: using IDEs for deep logic inspection, browsers for frontend validation, and AI for rapid interpretation and solution generation.


As an Amazon Associate, we may earn from qualifying purchases.
IDE-integrated debugging environments
Modern development rarely happens in a text editor alone. Integrated Development Environments (IDEs) bundle the compiler, debugger, and code editor into a single interface, allowing developers to step through execution, inspect memory, and modify variables in real time. For debugging specifically, the depth of the native debugger often determines how quickly a developer can isolate a bug.
The market is dominated by three major players: Visual Studio Code, JetBrains’ product suite, and Microsoft’s Visual Studio. Each offers a different philosophy on how to surface errors and manage complex state.
Visual Studio Code
VS Code has become the default choice for many developers due to its lightweight architecture and massive extension ecosystem. Its built-in debugger supports a wide range of languages through Node.js, Python, and C++ extensions. The interface is minimal, relying on the Debug Console and Variable Explorer to show state. While it requires more manual configuration than a full IDE, its speed and flexibility make it ideal for quick fixes and polyglot projects.
JetBrains IDEs
JetBrains products, including IntelliJ IDEA, PyCharm, and WebStorm, are known for their deep semantic understanding of code. Their debuggers are tightly integrated with the IDE’s refactoring and inspection tools. When you hit a breakpoint, the debugger can suggest code fixes, highlight dead code, and even predict potential null pointer exceptions before you run the code. This proactive approach reduces the time spent searching for the root cause of a bug.
Visual Studio
For .NET, C++, and enterprise-level applications, Visual Studio remains the gold standard. Its debugger is exceptionally powerful, offering features like IntelliTrace, which records every step of execution so you can rewind time to see exactly what happened before a crash. It also provides advanced memory diagnostics and performance profiling tools that are difficult to replicate in lighter editors. It is heavier and slower to start, but its debugging capabilities are unmatched for complex, large-scale solutions.
Comparison of IDE Debugging Features
The table below compares the core debugging capabilities of these three environments. Note that "AI" features refer to built-in suggestions or automated fix recommendations.
| IDE | Breakpoints | Variable Inspection | AI Integration | Best For |
|---|---|---|---|---|
| VS Code | Yes (Extensible) | Console + Explorer | GitHub Copilot | Polyglot & Web |
| JetBrains | Yes | Deep Inspection | Code Assistance | Java, Python, .NET |
| Visual Studio | Yes (Advanced) | Live Visual Debugging | IntelliCode | Enterprise & C++ |
AmazonProductGrid


Chrome DevTools and Network Debugging Utilities
Chrome DevTools remain the foundational instrument for frontend and full-stack development. Beyond the familiar Elements and Console tabs, the Network panel provides a granular view of HTTP traffic, allowing developers to inspect request headers, payload sizes, and timing metrics for every resource loaded by a page. This visibility is essential for identifying latency bottlenecks and debugging failed API calls before they reach the user.
For developers working with complex backend integrations, dedicated API clients like Postman offer a more structured environment for testing endpoints. Unlike the Network tab, which captures live traffic, Postman allows for the creation of reusable collections and automated test scripts, ensuring that RESTful services behave correctly across different environments.
The following tools are essential for a modern debugging workflow, covering both browser-based inspection and external API testing.


As an Amazon Associate, we may earn from qualifying purchases.
Command line debuggers for systems
When GUI-based IDEs hit a wall, command-line debuggers take over. Tools like GDB, LLDB, and WinDbg provide the granular control needed for low-level systems programming, kernel development, and embedded work. They allow developers to inspect raw memory, trace CPU registers, and analyze crash dumps in environments where a graphical interface is either impossible or too resource-intensive.
GDB: The GNU Standard
GDB remains the industry standard for C and C++ development on Linux and Unix-like systems. It offers deep integration with the GNU toolchain, allowing precise control over process execution, thread states, and memory layouts. For developers working on open-source infrastructure or embedded Linux, GDB is often the first line of defense against segmentation faults and race conditions.
LLDB: The Clang Alternative
LLDB, developed as part of the LLVM project, is the default debugger for macOS and iOS development. It is tightly integrated with the Clang compiler and offers a Python-based scripting interface for custom automation. Its modular architecture makes it particularly effective for high-performance applications and cross-platform development where speed and extensibility are priorities.
WinDbg: Windows Kernel Analysis
WinDbg is the primary debugging tool for Windows driver development and kernel-mode analysis. It excels at parsing complex crash dumps (minidumps and full memory dumps) to identify the root cause of system crashes (BSODs). Microsoft provides WinDbg as part of the Windows SDK, making it an essential component for anyone building drivers or analyzing Windows internals.


As an Amazon Associate, we may earn from qualifying purchases.
These tools require a steeper learning curve than visual debuggers, but their ability to interact directly with the operating system’s memory and execution state makes them indispensable for systems-level troubleshooting.
AI-powered code review and error fixing
AI assistants have shifted debugging from reactive patching to proactive root cause analysis. Instead of manually tracing stack traces, these tools parse execution logs and code context to identify the origin of a failure and suggest precise fixes. This reduces the mean time to resolution (MTTR) by handling the tedious context-gathering phase automatically.
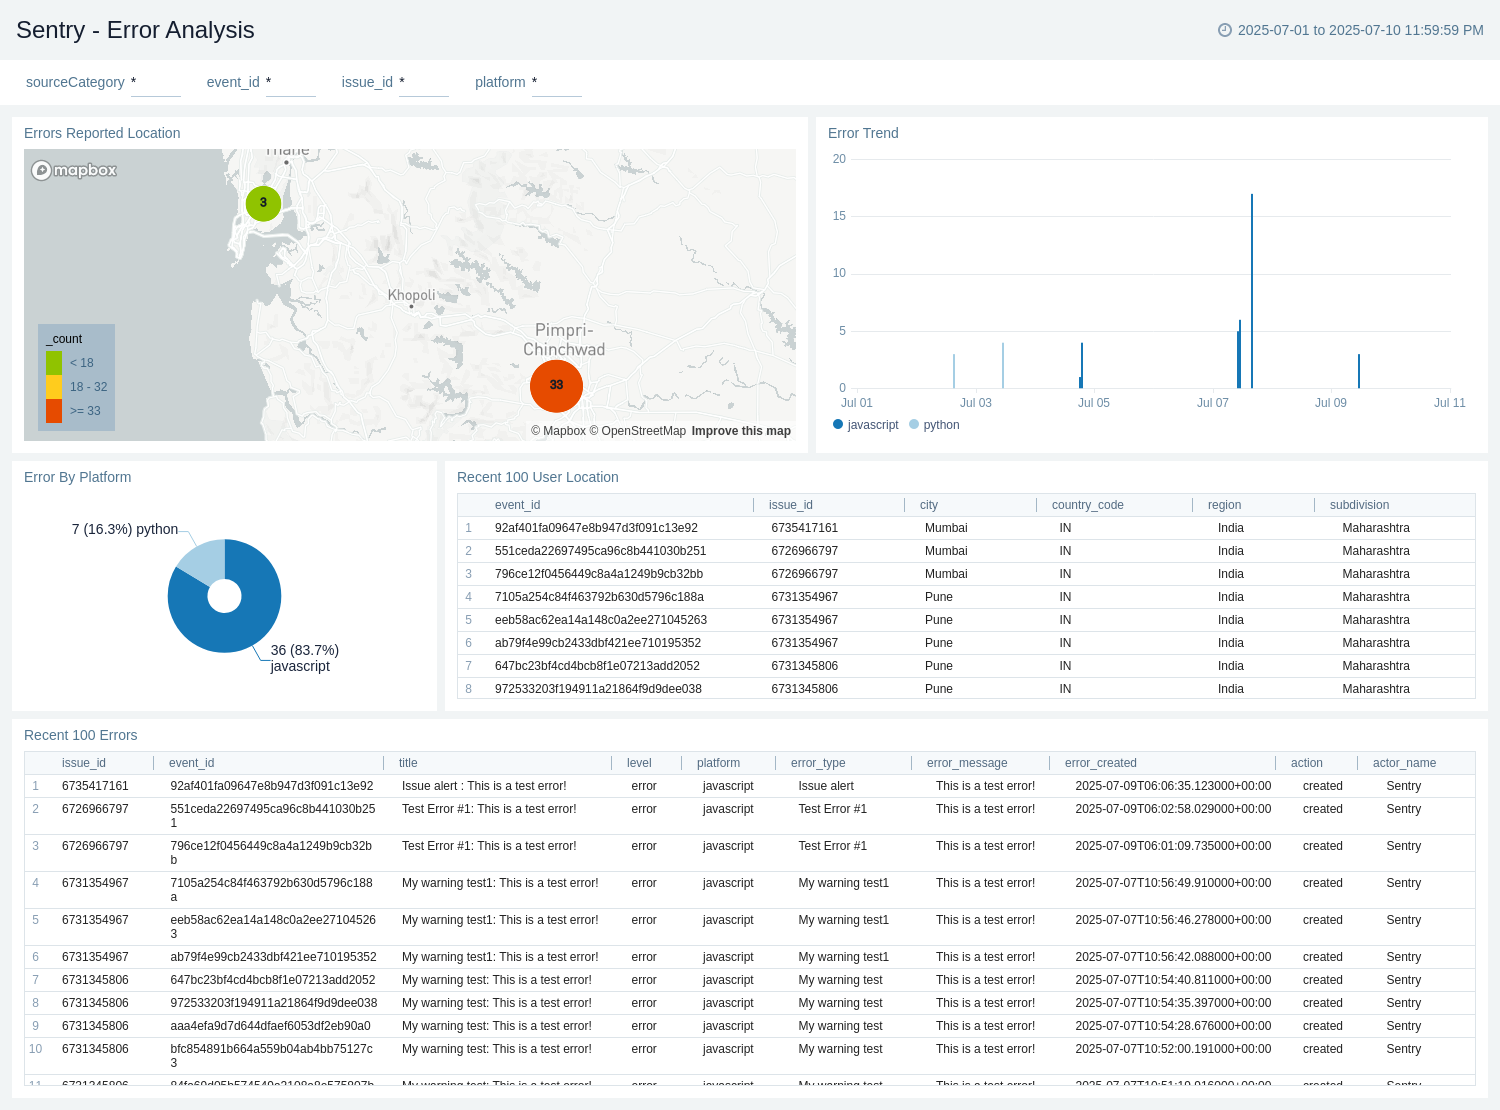
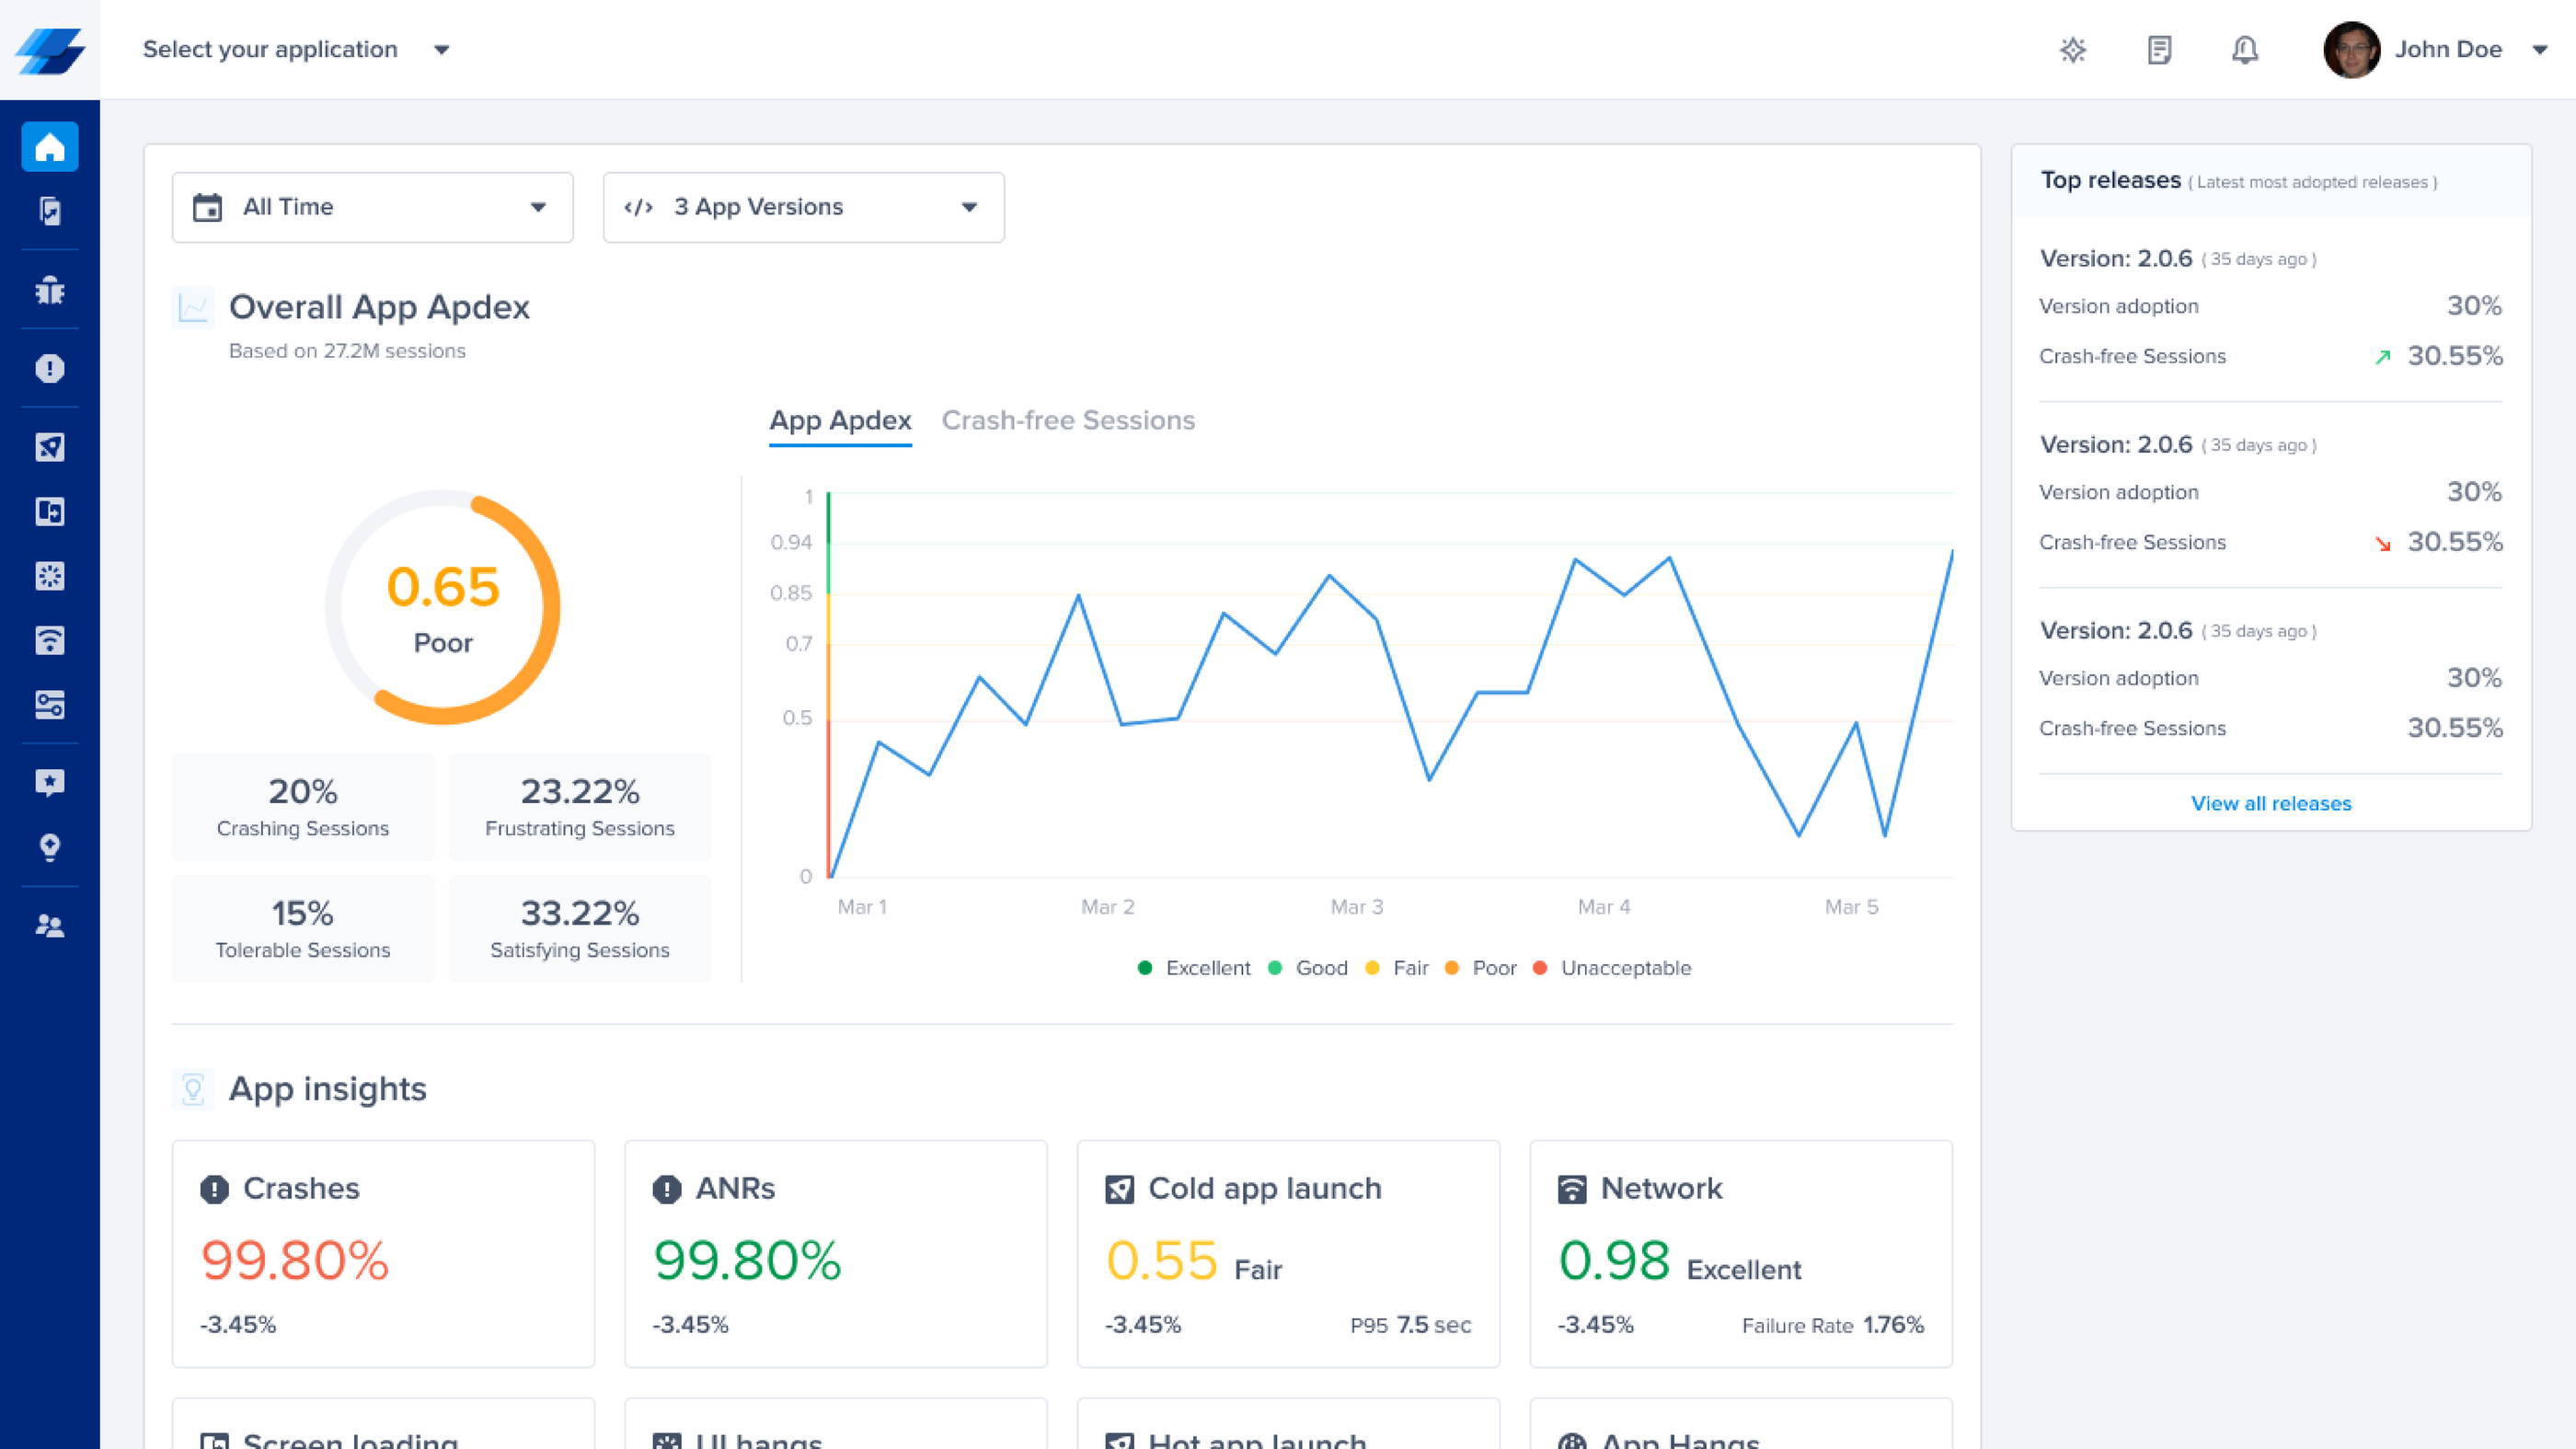
Modern platforms like Sentry and Instabug integrate this logic directly into the workflow. Sentry automates error root cause tracking, grouping similar exceptions and linking them to specific code commits. Instabug captures user-side data for mobile apps, providing a complete picture of the environment where the crash occurred. These tools act as force multipliers, allowing developers to address the underlying architecture rather than just the symptom.
When selecting an AI-driven solution, prioritize tools that offer granular context integration. The best assistants connect debugging data directly to your version control system, enabling one-click pull requests for suggested fixes. This tight loop transforms debugging from a solitary hunt into a collaborative, automated process.
As an Amazon Associate, we may earn from qualifying purchases.
Best debugging tools for 2026
Finding the right debugging environment often comes down to balancing language-specific features with system-level visibility. While integrated IDEs handle the bulk of daily code inspection, specialized tools remain essential for memory analysis, performance profiling, and low-level kernel debugging. The following tools cover the full spectrum from quick web fixes to deep system diagnostics.
Visual Studio Code (VSCode) remains the standard for general-purpose debugging. Its built-in debugger supports dozens of languages out of the box, and its extension ecosystem allows developers to tailor the environment for specific stacks. For web developers, Chrome DevTools provides the necessary depth to inspect DOM, network requests, and JavaScript execution in real time. JetBrains products like ReSharper and PyCharm offer similar deep integration for C# and Python, respectively, automating many of the manual checks that slow down other workflows.
When applications crash or behave unpredictably, command-line tools take over. WinDbg is the industry standard for analyzing Windows crash dumps and debugging live user-mode or kernel-mode code. It allows developers to examine CPU registers and memory states with precision that GUI tools cannot match. For broader system diagnostics, GDB (GNU Debugger) and LLDB provide robust CLI interfaces for C, C++, and Swift development across Linux and macOS environments.
For hardware and embedded development, software simulators often fall short. Hardware debuggers like JTAG adapters connect directly to the microcontroller, allowing developers to step through code at the instruction level. These tools are critical for diagnosing timing issues and memory corruption that only occur in the final deployed environment.


As an Amazon Associate, we may earn from qualifying purchases.
Debugging tools frequently asked: what to check next
Choosing the right debugging environment can save hours of frustration. Here are answers to the most common questions developers ask when selecting tools for their workflow.

No comments yet. Be the first to share your thoughts!