
Why debugging tools matter now
Debugging used to be a solitary act of patience. You set a breakpoint, stepped through code line by line, and prayed you spotted the typo. That era is over. In 2026, debugging is less about finding the needle in the haystack and more about having a machine that hands you the needle, wrapped in a note explaining why it was there.
The shift isn't just about speed; it's about context. Modern tools like Visual Studio Code and PyCharm Debugger no longer just highlight syntax errors. They integrate AI assistants that can read your entire codebase, understand the intent behind your functions, and suggest fixes that actually align with your project's architecture. This reduces the cognitive load of context switching, allowing you to stay in the flow state rather than jumping between documentation tabs and Stack Overflow.
This evolution means that the best debugging tools today are those that automate the tracking of errors before they ever reach production. Instead of waiting for a user to report a crash, tools like Chrome DevTools and Postman now offer proactive monitoring and automated tracing. The goal has moved from reactive fire-fighting to proactive prevention, making the debugging process an integral part of the development workflow rather than a separate, dreaded phase.
Top IDEs for built-in debugging
Most debugging still happens inside the Integrated Development Environment. In 2026, the heavy lifting is done by the editors that know your code structure best. These tools don't just show you errors; they understand context, allowing for faster fixes without leaving your workflow.
Visual Studio Code remains the default choice for many developers. Its lightweight nature and massive extension library mean you can tailor the debugging experience to almost any language. The built-in debugger handles JavaScript, Python, and TypeScript with ease, while AI assistants now help interpret complex stack traces directly in the editor.
JetBrains IntelliJ IDEA is the powerhouse for Java and Kotlin development. Its debugger is deeply integrated with the platform, offering features like smart step-into and conditional breakpoints that feel intuitive rather than manual. For teams working in large enterprise ecosystems, this depth of integration saves significant time during complex troubleshooting sessions.
Microsoft Visual Studio continues to dominate the .NET and C++ space. It offers a robust, full-featured debugging suite that handles everything from basic syntax errors to intricate memory leaks in native code. While heavier than VS Code, its performance profiling and diagnostic tools are unmatched for large-scale desktop and game development projects.
AI-powered debugging assistants
Use this section to make the Best Debugging Tools for decision easier to compare in real life, not just on paper. Start with the reader's actual constraint, then separate must-have requirements from details that are merely nice to have. A practical choice should survive normal use, maintenance, timing, and budget. If a recommendation only works in an ideal situation, call that out plainly and give the reader a fallback path.
The simplest way to use this section is to write down the must-have criteria first, then compare each option against those criteria before weighing nice-to-have features.
Specialized debuggers for deep dives
Use this section to make the Best Debugging Tools for decision easier to compare in real life, not just on paper. Start with the reader's actual constraint, then separate must-have requirements from details that are merely nice to have. A practical choice should survive normal use, maintenance, timing, and budget. If a recommendation only works in an ideal situation, call that out plainly and give the reader a fallback path.
The simplest way to use this section is to write down the must-have criteria first, then compare each option against those criteria before weighing nice-to-have features.
Bug tracking and code review tools
Use this section to make the Best Debugging Tools for decision easier to compare in real life, not just on paper. Start with the reader's actual constraint, then separate must-have requirements from details that are merely nice to have. A practical choice should survive normal use, maintenance, timing, and budget. If a recommendation only works in an ideal situation, call that out plainly and give the reader a fallback path.
The simplest way to use this section is to write down the must-have criteria first, then compare each option against those criteria before weighing nice-to-have features.
Choosing the right debugging stack
Use this section to make the Best Debugging Tools for decision easier to compare in real life, not just on paper. Start with the reader's actual constraint, then separate must-have requirements from details that are merely nice to have. A practical choice should survive normal use, maintenance, timing, and budget. If a recommendation only works in an ideal situation, call that out plainly and give the reader a fallback path.
-
Verify the basicsConfirm the core specs, condition, and fit before comparing extras.
-
Price the downsideLook for the repair, maintenance, or replacement cost that would change the decision.
-
Compare alternativesCheck at least two comparable options before treating one listing as the benchmark.
Frequently asked questions about debugging tools
Helpful gear
Use these product recommendations as a starting point, then choose the size, material, and price point that fit how you actually use the gear.

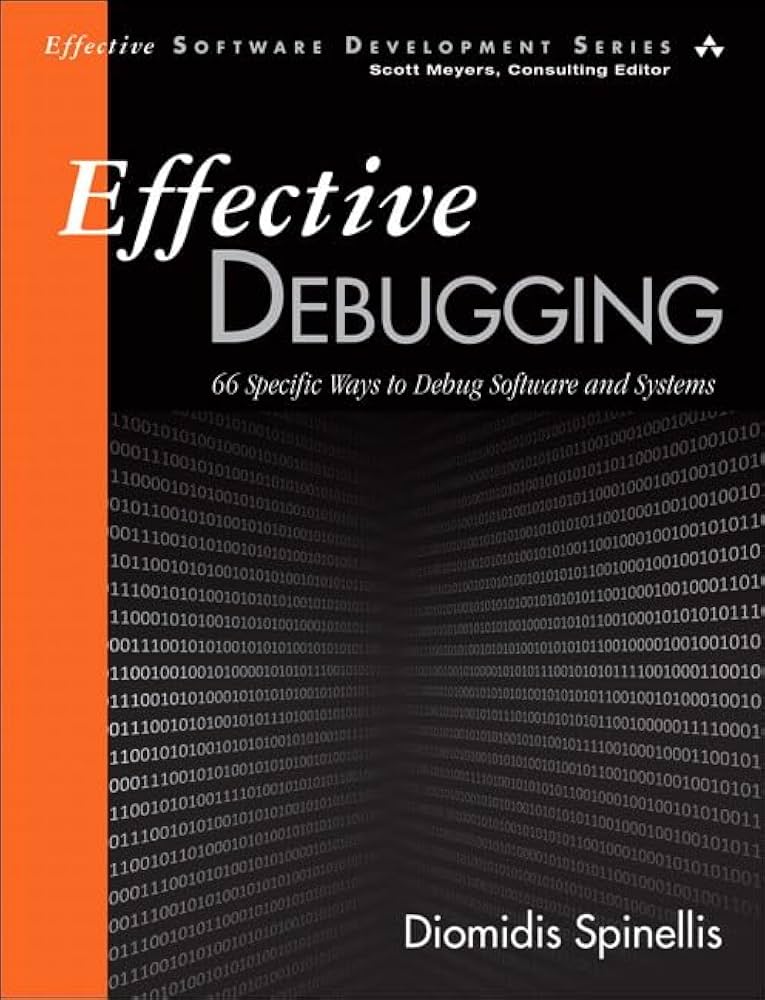

As an Amazon Associate, we may earn from qualifying purchases.

No comments yet. Be the first to share your thoughts!