
Why AI debugging matters now
Debugging used to be a game of patience and guesswork. You set a breakpoint, step through line by line, and hope you spot the typo or logic error before the coffee runs out. It works for small scripts, but modern codebases are too large and interconnected for that manual approach to scale. By 2026, the sheer volume of dependencies means a single bug can hide in layers of abstraction that no human can easily trace by hand.
AI-assisted debugging changes this dynamic by shifting the focus from "stepping" to "root cause analysis." Instead of manually tracing execution, these tools analyze patterns in your logs, stack traces, and code context to pinpoint the likely source of the error. It’s the difference between searching for a needle in a haystack by pulling out every piece of straw one by one, versus using a magnet that pulls the needle directly to the surface.
This shift isn’t just about speed; it’s about accuracy. AI tools can correlate errors across distributed systems, spotting issues that might look unrelated in isolation. For developers, this means spending less time hunting for the bug and more time fixing it. The result is a significant reduction in fix time, allowing teams to ship stable software without burning out on endless debugging sessions.
5 AI-Powered Debugging Tools That Cut Fix Time in Half
Stop guessing where the bug lives and start fixing it. These five AI-powered debugging tools cut fix time in half by pinpointing errors in real-world scenarios, letting you ship code faster without the guesswork.
-
DeepCode AI for real-time code analysis
DeepCode acts like a tireless pair programmer that spots logic errors before they hit production. It scans your codebase in real-time, highlighting subtle bugs that human eyes often miss during late-night coding sessions. This immediate feedback loop means you fix issues while the context is fresh, drastically reducing the time spent hunting down elusive runtime errors. -
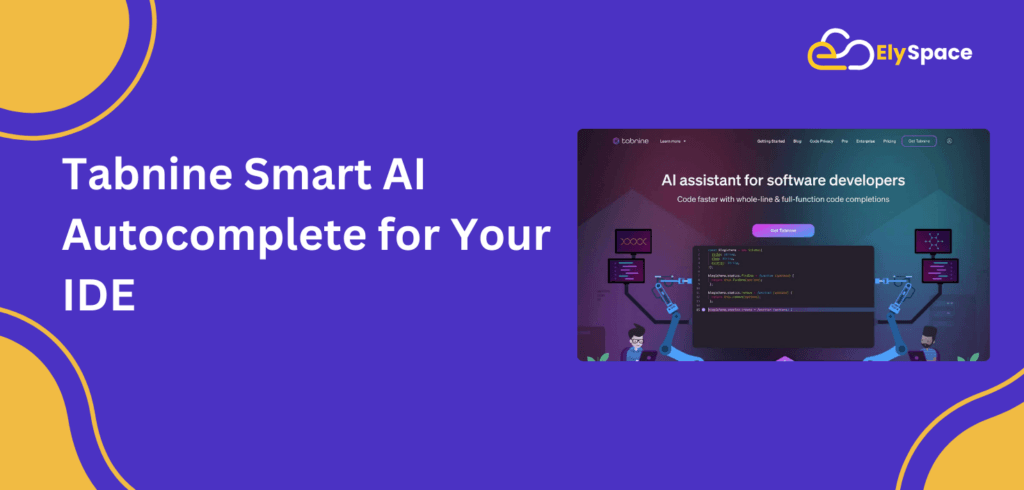
Tabnine Autocomplete for faster error correction
Tabnine goes beyond simple text completion by predicting entire function blocks based on your current context. When you hit a syntax wall, it suggests corrected code paths instantly, keeping your flow state intact. This predictive capability accelerates the correction of minor typos and structural mistakes, allowing developers to resolve common errors without breaking their concentration or switching contexts. -
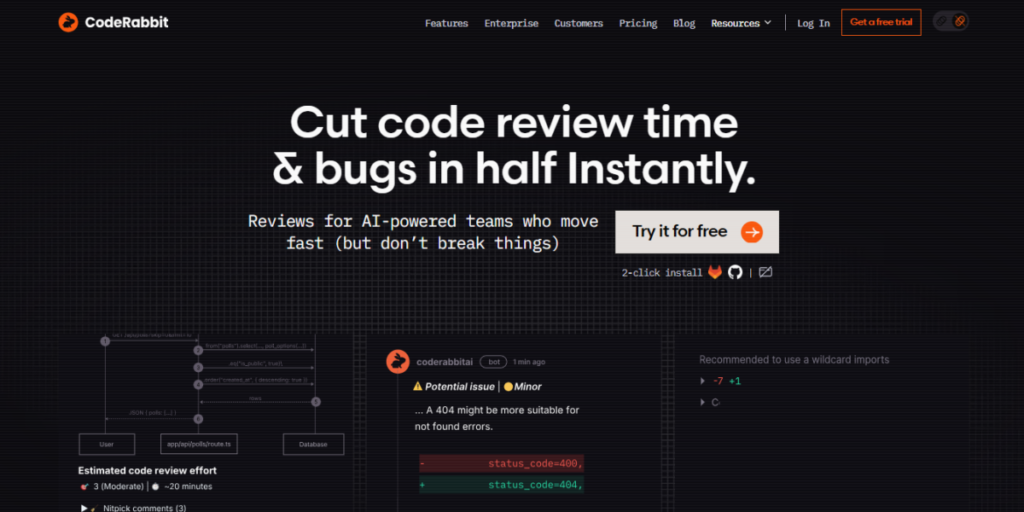
Snyk Code for automated vulnerability detection
Snyk Code integrates directly into your IDE to flag security flaws as you type, rather than waiting for a post-commit scan. It identifies potential injection points and unsafe dependencies immediately, preventing security holes from becoming entrenched in your logic. This proactive approach ensures that debugging isn't just about functionality but also about maintaining a secure codebase without tedious manual audits later. -
Amazon CodeGuru Reviewer for performance optimization
Amazon CodeGuru Reviewer uses machine learning to analyze your code for performance bottlenecks and quality issues. It provides actionable recommendations to improve execution speed and reduce resource consumption, which is crucial for scalable applications. By automating the identification of inefficient loops or memory leaks, it helps teams optimize code performance without requiring deep expertise in every specific language framework. -
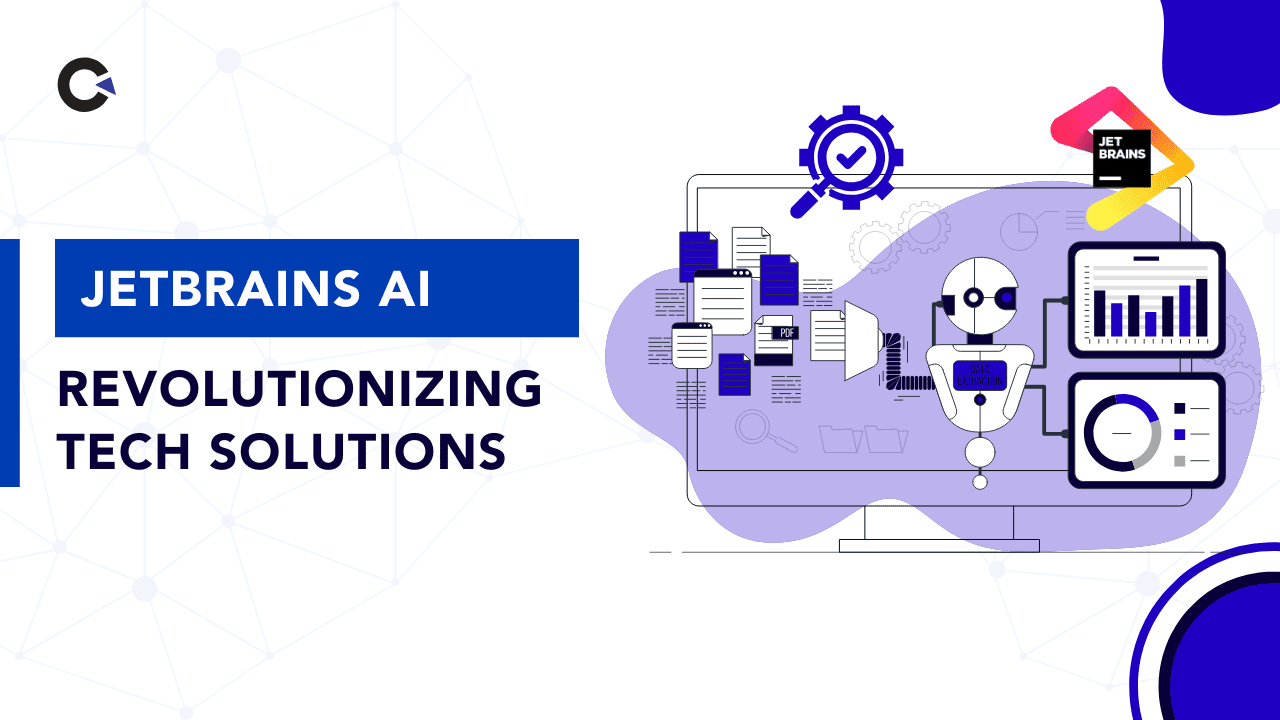
JetBrains AI Assistant for intelligent refactoring
The JetBrains AI Assistant helps streamline the messy process of code refactoring by suggesting cleaner, more efficient structures. It understands the broader context of your project, allowing for safe transformations that maintain functionality while improving readability. This intelligent assistance reduces the cognitive load of restructuring complex modules, ensuring that code remains maintainable and bug-free as the project evolves over time.
How AI changes code review workflows
The biggest shift isn't just about finding bugs; it's about how those findings fit into your daily routine. Instead of waiting for a separate QA cycle or a frantic Slack message at 4:55 PM, AI debugging tools now live right inside the editor where you write code. This means you get instant feedback on syntax errors or logical flaws before you even save the file.
These tools are designed to work alongside the IDE recommendations and bug tracking systems you already use. For instance, an AI suggestion in VS Code can automatically create a ticket in Jira or GitHub Issues with the relevant code snippet and error logs attached. This removes the friction of manually reproducing the issue and writing a detailed report, turning a five-minute administrative task into a background process.
By integrating directly with your existing workflow, these tools reduce context switching. You stay in the "flow" of coding while the AI handles the heavy lifting of classification and prioritization. The result is a smoother transition from identifying a problem to fixing it, keeping your team focused on building features rather than chasing ghosts.



As an Amazon Associate, we may earn from qualifying purchases.
Choosing the right AI assistant
Picking an AI debugging tool is less about finding the "smartest" model and more about fitting the tool into your existing workflow. The best assistant is the one that understands your stack without requiring you to rewrite your build process or switch IDEs.
Start by checking language support. If you are working in Python or JavaScript, most modern AI assistants integrate directly into VS Code or JetBrains IDEs, offering inline suggestions as you type. For C++ or Rust, you might need tools that hook into deeper system-level debuggers like GDB or LLDB to handle memory issues effectively.
Integration depth matters just as much. A tool that requires you to copy-paste error logs into a web chat will slow you down. Look for assistants that can read your local context—your current file, open terminals, and error traces—so they can suggest fixes without breaking your flow.
Finally, consider your budget. While many tools offer free tiers for individual developers, teams often need collaborative features and higher usage limits. Evaluate whether the time saved on debugging justifies the subscription cost for your specific use case.

No comments yet. Be the first to share your thoughts!