Why AI debugging matters now
Debugging has always been the most time-consuming part of writing software. For years, the process relied on manual stepping through code, reading stack traces, and guessing where the logic broke. This approach works for small scripts, but it becomes a bottleneck as applications grow in complexity.
AI-powered debugging tools change this dynamic by automating the heavy lifting. Instead of staring at logs for hours, these tools analyze patterns in your codebase and historical fixes to suggest root causes. They act like a pair of experienced eyes, spotting issues you might miss because you are too close to the code.
This shift from manual stepping to AI-assisted analysis significantly reduces mean time to resolution (MTTR). By handling the initial investigation, these tools let you focus on the actual fix rather than the hunt. This is particularly valuable for junior developers learning the ropes and senior engineers managing large, legacy codebases.
The goal isn't to replace your judgment, but to remove the friction. When you spend less time finding the bug, you spend more time building features. That is why we selected tools that integrate smoothly into your existing workflow, offering concrete help without adding new complexity.
5 AI-Powered Debugging Tools That Cut Fix Time in 2026
Debugging shouldn't feel like a guessing game, especially when you're racing against a deadline. These five AI-powered tools cut through the noise by pinpointing errors instantly, letting you focus on writing clean code rather than hunting for bugs.
-
Codeium's AI-powered autocomplete for rapid error correction
Codeium transforms the debugging workflow by predicting and inserting correct syntax before you finish typing. Its autocomplete engine analyzes your current context to suggest fixes for common typos and logical errors instantly. This proactive approach reduces the back-and-forth between writing and checking, allowing developers to maintain flow while catching mistakes early. The tool integrates seamlessly into popular editors, making it a lightweight yet powerful ally for speeding up routine code corrections. -
Amazon CodeWhisperer's security vulnerability detection capabilities
Security often lurks in the shadows of standard debugging, but CodeWhisperer shines a light here. It scans your code in real-time to identify potential security flaws, such as hardcoded credentials or unsafe API calls. By flagging these vulnerabilities during the coding phase, it prevents costly post-deployment patches. This feature is essential for teams prioritizing secure development lifecycles, offering a protective layer that complements traditional logic debugging with robust security awareness. -
GitHub Copilot Chat for contextual code explanation
Sometimes the bug isn't in the syntax, but in the misunderstanding of complex logic. GitHub Copilot Chat acts as an on-demand mentor, explaining intricate code blocks in plain language. When you encounter a confusing function or an unexpected behavior, you can ask for a breakdown of how the code works. This clarity helps developers pinpoint logical errors faster by revealing the underlying intent versus the actual implementation, bridging the gap between confusion and comprehension. -
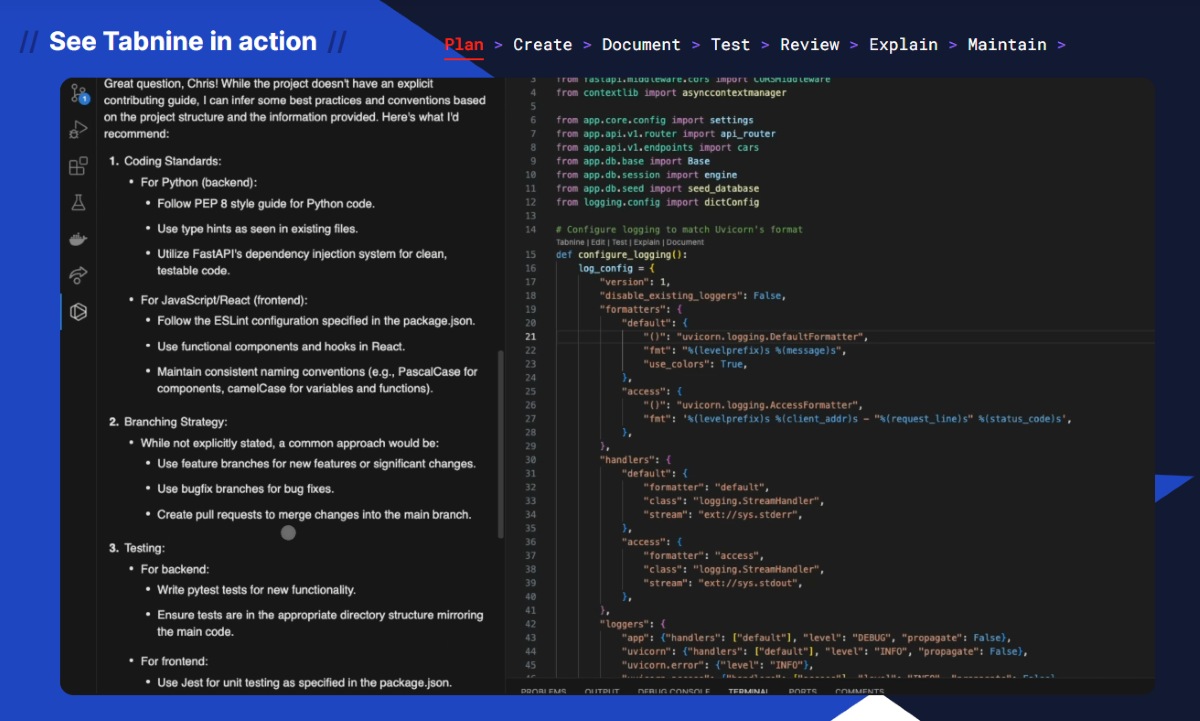
Tabnine's privacy-focused local model debugging
For teams handling sensitive intellectual property, Tabnine offers a crucial advantage: local model execution. By running AI models directly on your machine, it ensures that no code leaves your environment during debugging sessions. This privacy-first approach allows developers to leverage AI assistance for error detection without compliance worries. The local inference maintains performance while providing a secure sandbox for analyzing proprietary codebases, making it ideal for regulated industries where data sovereignty is non-negotiable. -

Replit AI agent for automated bug fixing
Replit takes debugging a step further by not just identifying issues but actively resolving them. Its AI agent can analyze error logs and apply patches directly to the codebase. This automated remediation is particularly useful for repetitive bugs or configuration errors that consume disproportionate time. By handling the mechanical aspects of fixing, it allows developers to focus on higher-level architecture and feature development, significantly reducing the total time spent on maintenance and troubleshooting cycles.
Top 5 AI debugging tools for 2026
Finding the right AI debugging assistant can feel like searching for a needle in a haystack, but the landscape has shifted. Instead of vague promises, we are looking at concrete tools that actively reduce fix time by identifying root causes before you even hit run. Whether you are squashing a race condition in a microservice or untangling a CSS grid nightmare, these five tools bring distinct advantages to your workflow.
Each tool here has been evaluated on its ability to save time and reduce error rates, rather than just adding another layer of complexity. We have stripped away the marketing fluff to focus on what actually matters: integration speed, accuracy of suggestions, and how well the AI understands your specific codebase context.
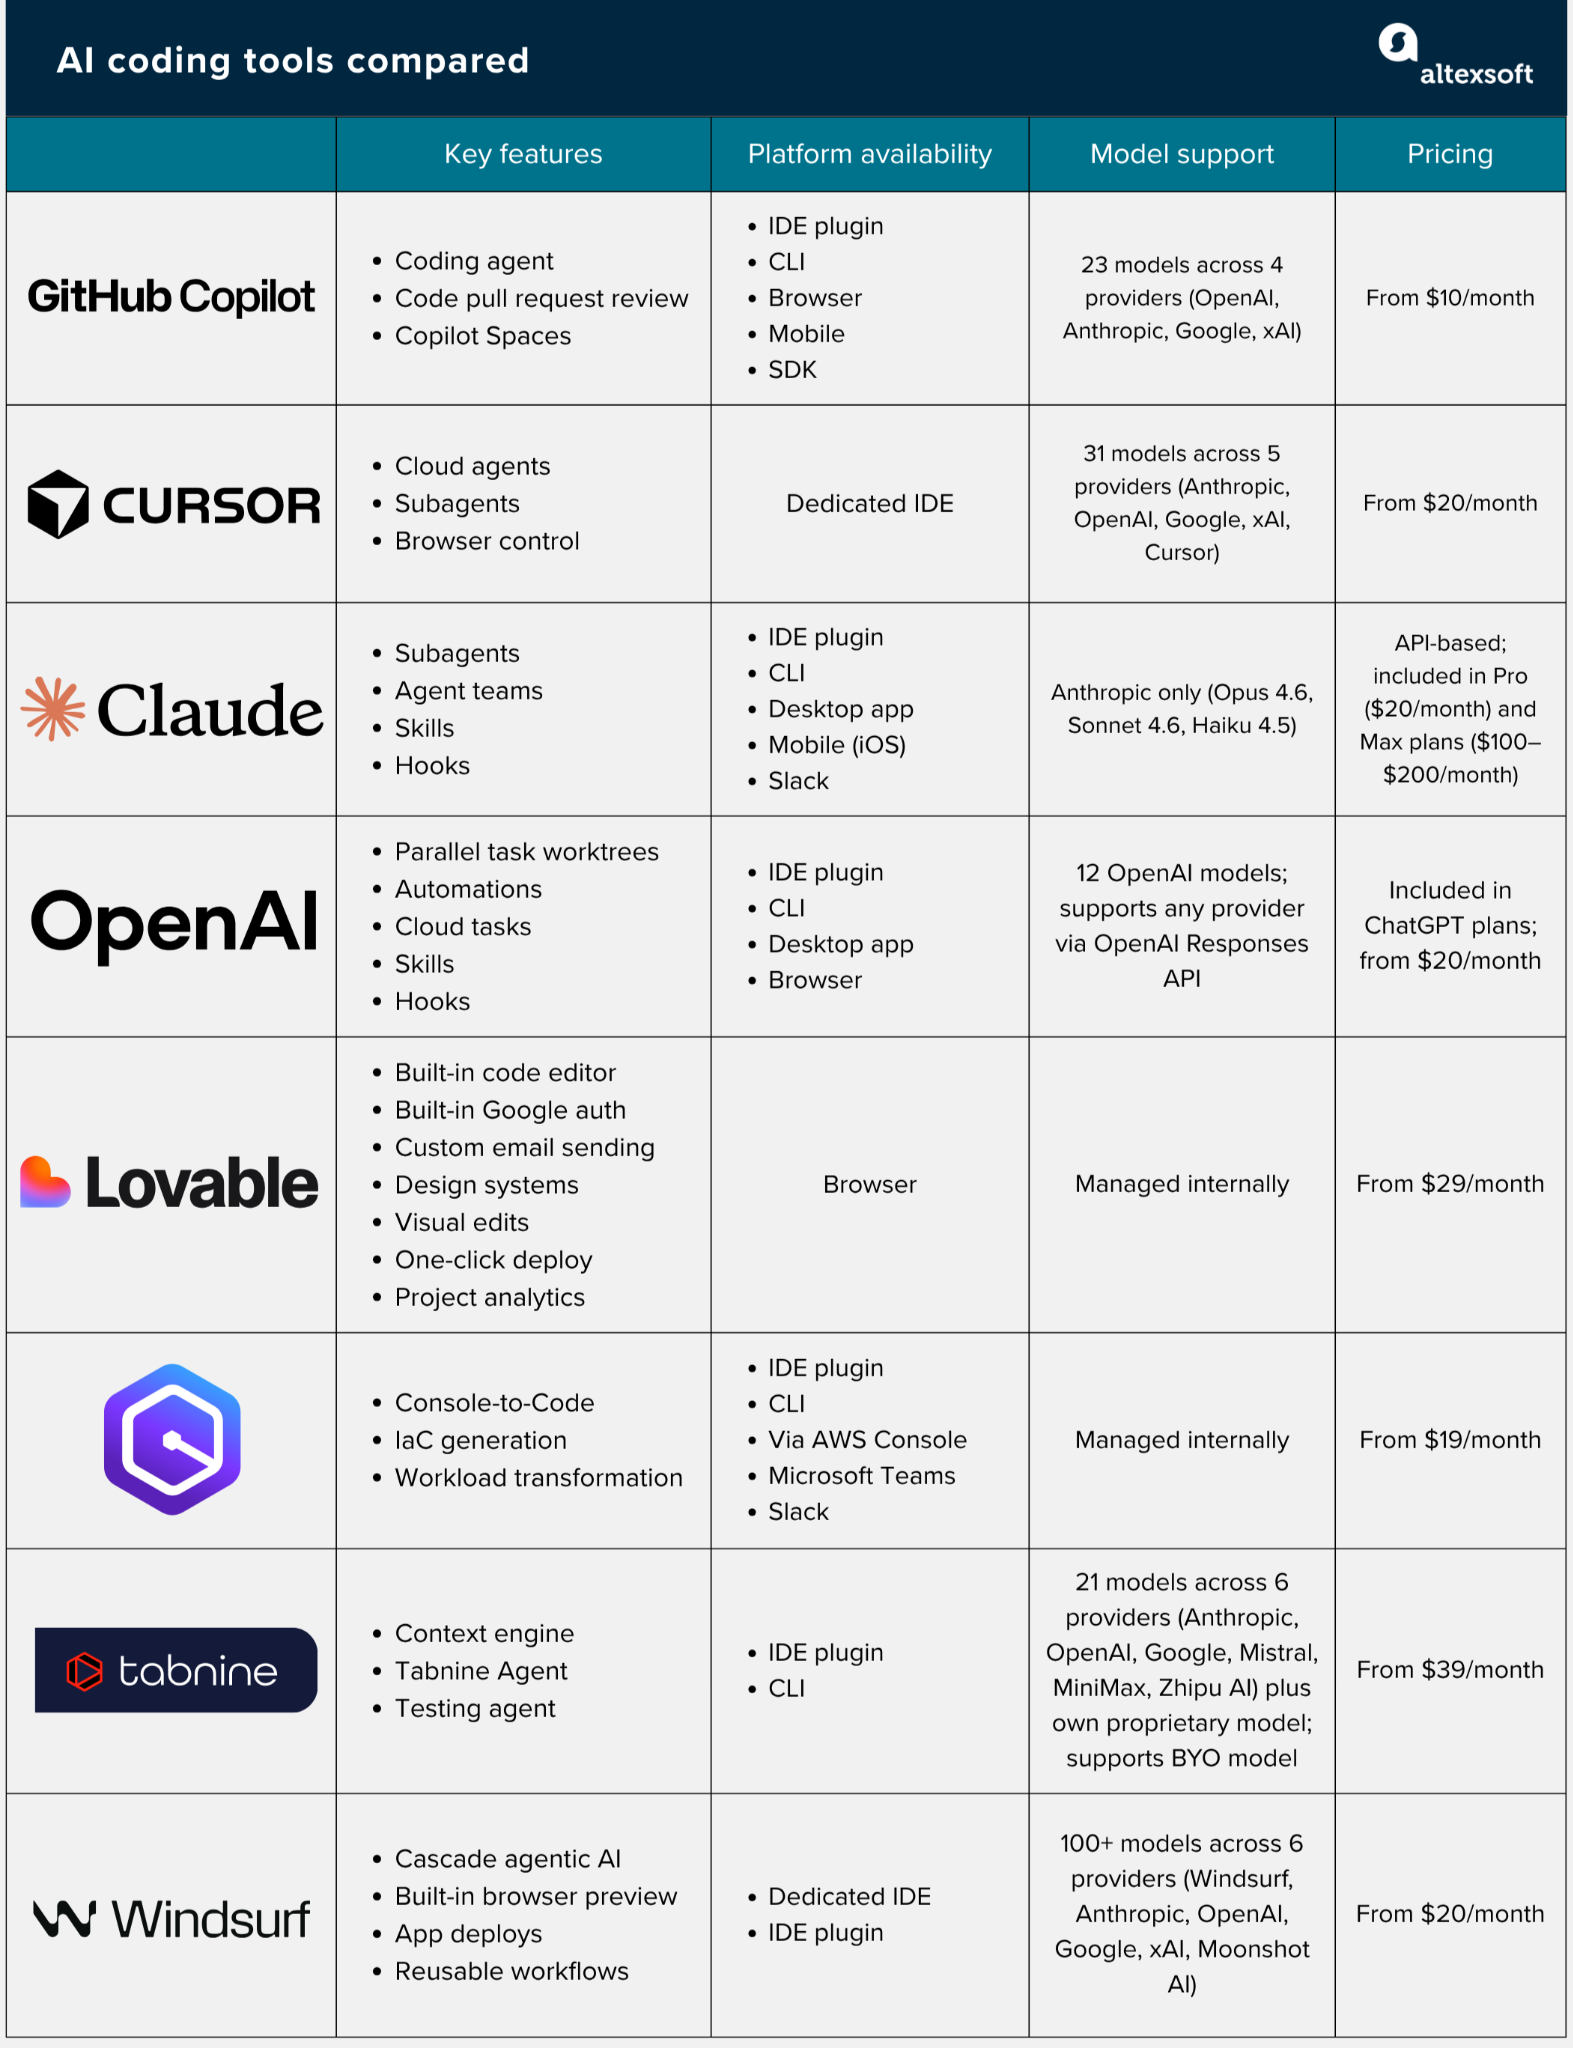
To help you compare them at a glance, here is a breakdown of their primary use cases, AI capabilities, and integration types.
1. Sentry Sentry remains the gold standard for automated error root cause tracking. Its AI capabilities focus on clustering similar errors and suggesting the likely commit that introduced the bug. This is particularly useful for production environments where you need to triage hundreds of alerts quickly. It integrates seamlessly with most CI/CD pipelines, allowing you to catch issues before they reach users.
2. GitHub Copilot While known for code generation, Copilot’s debugging features are increasingly powerful. It provides context-aware suggestions directly within your IDE, helping you spot logical errors and missing edge cases as you type. This in-editor assistance reduces the need to switch contexts between your code and external documentation, keeping you in the flow.
3. Datadog For teams running complex, full-stack applications, Datadog offers robust anomaly detection powered by AI. It goes beyond simple logging by analyzing patterns across your entire infrastructure. If a spike in latency correlates with a specific service deployment, Datadog can highlight this relationship, helping you isolate the problem faster than manual log searching.
4. Instabug Instabug specializes in mobile app debugging by turning user feedback into actionable bug reports. Its AI analyzes screenshots, network logs, and device data to reproduce issues on the developer’s end. This is a massive time-saver for mobile teams, as it eliminates the guesswork often associated with reproducing bugs on different devices and OS versions.
5. PyCharm Debugger For Python developers, PyCharm’s debugger offers intelligent breakpoints that pause execution only when specific conditions are met. Its AI-driven insights help identify logical errors in complex data structures. This targeted approach reduces the time spent stepping through irrelevant code, allowing you to focus on the actual source of the problem.


As an Amazon Associate, we may earn from qualifying purchases.
How to choose the right debugging tool
Picking a debugging tool isn't about finding the "best" one in a vacuum; it's about finding the one that fits your current stack and team size. A tool that cuts fix time in half for a solo Python developer might be overkill for a small JavaScript team, or vice versa. Start by looking at the concrete features that directly impact your daily workflow rather than abstract AI promises.
Check your language and framework support
The first filter is simple: does the tool understand your code? If you are working in C++, a tool built primarily for JavaScript will create more friction than it removes. Look for native integration with your primary language server or IDE. For example, if you are deep in the Windows ecosystem, tools like WinDbg offer deep kernel-level visibility that generic AI wrappers simply cannot match. Ensure the tool can parse your specific framework structures, whether that's React components, Django models, or Spring Boot beans.
Evaluate integration with your CI/CD pipeline
Debugging shouldn't stop when code leaves your local machine. The most effective tools integrate seamlessly into your continuous integration and deployment pipeline. This means they can automatically analyze crash dumps or error logs the moment a build fails. If a tool requires manual upload of logs or separate authentication steps, it will likely sit unused. Look for native plugins for GitHub Actions, GitLab CI, or Jenkins that allow the AI to trigger on specific failure conditions without human intervention.
Consider team size and collaboration features
For solo developers, a tool that just points out the bug is enough. For teams, the debugging tool needs to act as a collaborator. Look for features that allow you to share context, annotate AI findings, or export debugging sessions to Jira or Linear. If your team is large, ensure the tool supports role-based access and doesn't expose sensitive source code to external AI models unless you have an on-premise deployment option.
Verify the AI's transparency and accuracy
Not all AI debugging is created equal. Some tools simply rephrase the error message, while others actually trace the execution path to the root cause. Look for tools that provide a "why" explanation, showing the specific line of code and the variable state that led to the error. If the tool cannot explain its reasoning, it is just another guess. Prioritize tools that offer high confidence scores or allow you to verify the suggested fix against your existing test suite.
Integrating AI into your workflow
Adopting AI debugging tools doesn't require a complete overhaul of your existing process. Think of these tools as a co-pilot rather than an autopilot: they assist with the heavy lifting of pattern recognition while you maintain control over the final code decisions. This approach minimizes disruption and allows you to reap immediate time-saving benefits without risking critical errors.
Start with non-critical code paths
Before relying on AI suggestions for core logic, test the tools on isolated modules or less critical parts of your application. This sandboxing approach lets you verify the accuracy of AI-generated fixes and understand the tool's specific strengths and limitations. You can build confidence in the technology's reliability without putting your entire system at risk.
Configure context and rules
Most effective AI debuggers require clear context to provide relevant suggestions. Ensure your IDE or debugging environment is properly configured with your project's specific language versions, dependencies, and coding standards. Providing this context helps the AI filter out irrelevant noise and focus on issues that matter to your specific codebase, significantly reducing false positives.
Review and iterate
Never blindly accept AI-generated fixes. Always review the suggested changes to ensure they align with your project's architecture and don't introduce new side effects. Treat the AI's output as a draft that requires your expert eye. This iterative review process not only ensures code quality but also helps you learn from the AI's reasoning, gradually improving your own debugging intuition.
Frequently asked questions about AI debugging
Is AI debugging secure for my codebase? Most modern AI debugging tools operate within your local environment or use encrypted connections to process snippets, ensuring your proprietary source code doesn't leave your control. However, always review the privacy policy of any cloud-based assistant before pasting sensitive logic. Treating these tools like a pair of eyes rather than a storage vault helps maintain security while you catch bugs faster.
Can AI replace manual debugging entirely? AI accelerates the detection of syntax errors and common logic flaws, but it doesn't replace the need for human oversight on complex architecture. Think of AI as a tireless junior developer who spots obvious issues instantly, while you focus on the deeper system design. This partnership reduces fix time significantly without sacrificing the quality of your final build.
Which AI debugging tool is best for beginners? For those just starting out, tools that integrate directly into your editor—like GitHub Copilot or VS Code's IntelliSense—are ideal because they provide context-aware suggestions without requiring extra setup. These features help you learn best practices as you code, turning every error message into a quick learning moment rather than a roadblock.

No comments yet. Be the first to share your thoughts!