How debugging tools fit your workflow
Debugging tools generally fall into three distinct categories based on where they run and how they interact with your codebase. Choosing the right environment depends on your language, deployment target, and whether you need deep kernel-level access or quick browser-side inspection.
IDE-integrated debuggers
Integrated Development Environments (IDEs) like Visual Studio, PyCharm, and Visual Studio Code provide the most common debugging experience. These tools offer rich UIs with breakpoint management, variable inspection, and call stack visualization within the editor. VS Code, for example, supports JavaScript, TypeScript, and Node.js out of the box, while extensions add support for Python, C++, and Go. This category is ideal for local development where you need to step through logic and inspect state in real-time.
CLI-based debuggers
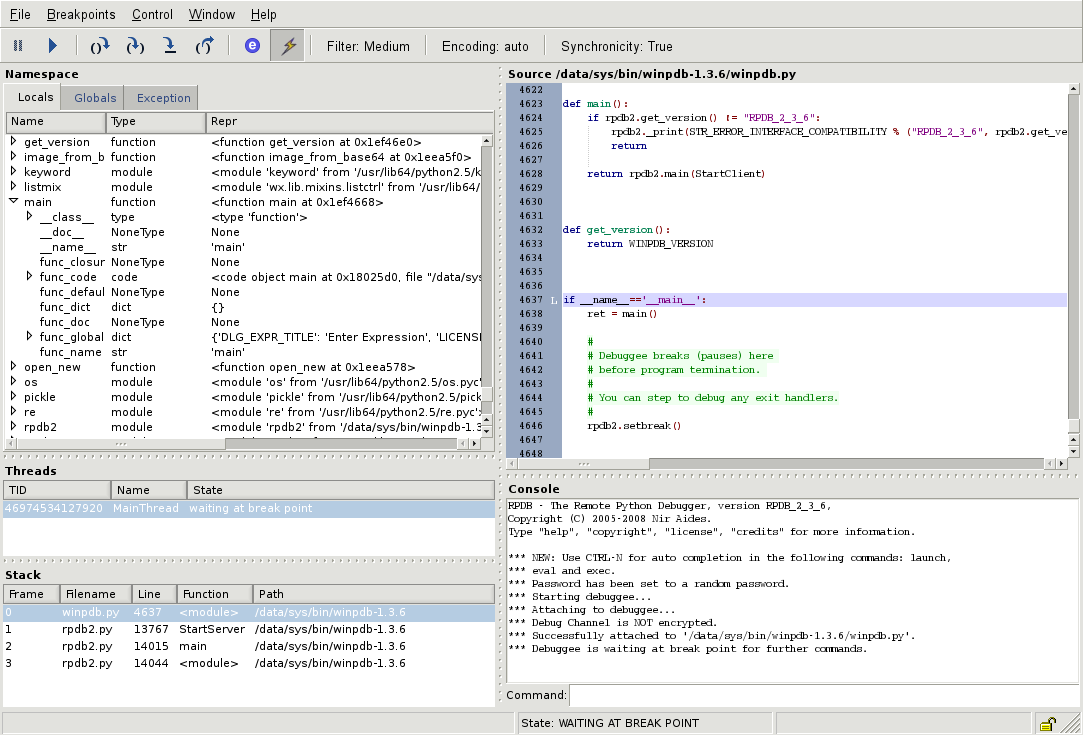
Command-line interface (CLI) debuggers such as GDB (GNU Debugger), LLDB, and WinDbg operate without a graphical interface. They are essential for low-level debugging, particularly when working with C/C++, system kernels, or analyzing crash dumps. WinDbg, part of the Windows SDK, is the standard for debugging Windows drivers and applications. CLI tools are often preferred in server environments, CI/CD pipelines, or when debugging remote processes where a GUI is not available.
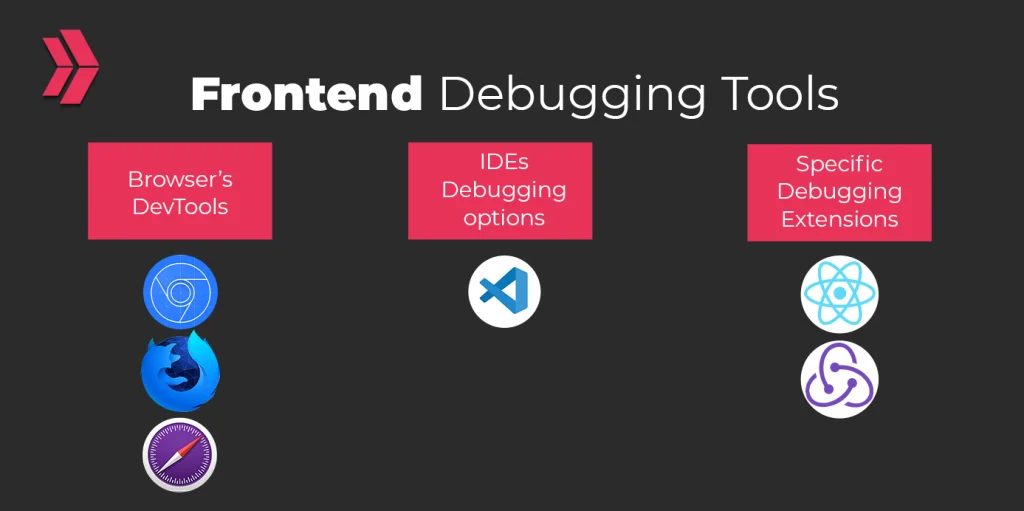
Browser-based debuggers
Browser developer tools, primarily Chrome DevTools, are indispensable for front-end development. They allow you to inspect the DOM, monitor network requests, debug JavaScript in the browser context, and analyze performance metrics. These tools run directly in the browser, making them the only option for debugging client-side code that runs in the user's environment. They are critical for resolving issues related to rendering, asynchronous data fetching, and client-side logic.
IDE-integrated debugging environments
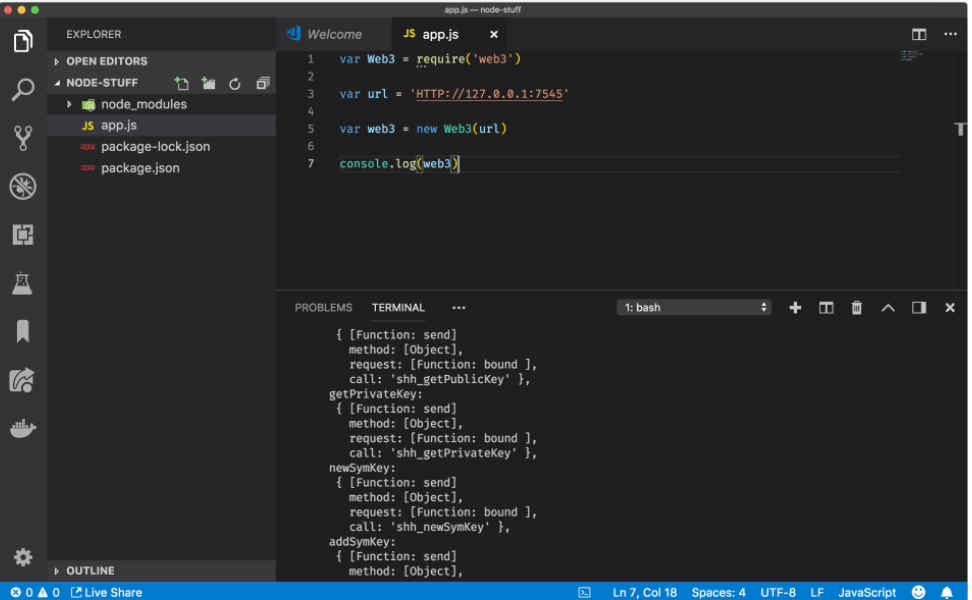
Modern development workflows rarely rely on console logging alone. Integrated Development Environments (IDEs) provide the scaffolding for structured debugging, allowing developers to pause execution, inspect memory states, and step through code without leaving the editor. For 2026, the market is dominated by two distinct philosophies: the lightweight, extension-driven approach of Visual Studio Code and the deeply integrated, language-aware ecosystems of JetBrains.
Visual Studio Code has become the default debugging interface for many teams due to its low barrier to entry and vast extension marketplace. Its debugger for Node.js, JavaScript, and TypeScript is built-in, offering a seamless experience for frontend and full-stack web development. For other languages, extensions like Python, C++, or Java provide comparable breakpoint management and variable inspection. The trade-off is that debugging depth often depends on the quality and maintenance of third-party extensions, which can vary in stability.
JetBrains products, such as PyCharm for Python and IntelliJ IDEA for Java, take a different approach. These IDEs are compiled with deep language understanding, meaning the debugger is aware of the language's specific semantics. This allows for more advanced features like intelligent variable evaluation, complex object graph visualization, and database integration within the debugging session. While the initial setup is heavier and the licensing costs are higher, the debugging experience is often more cohesive and powerful for large, complex codebases.
The following table compares the core debugging capabilities of the three most prominent IDEs, focusing on cost, primary language support, and the depth of debugging features available out of the box.
| IDE | Price | Primary Languages | Debugging Depth |
|---|---|---|---|
| Visual Studio Code | Free | JavaScript, TypeScript, Python, C++, Java (via extensions) | Strong for web; varies by extension |
| PyCharm | Free (Community) / Paid (Professional) | Python, Django, SQL | Deep Python-specific features, DB integration |
| IntelliJ IDEA | Free (Community) / Paid (Ultimate) | Java, Kotlin, Scala | Advanced object inspection, multi-threading |
| Visual Studio | Free (Community) / Paid (Pro/Enterprise) | C#, C++, F#, Python | Enterprise-grade, full framework support |
Command-line debuggers for low-level work
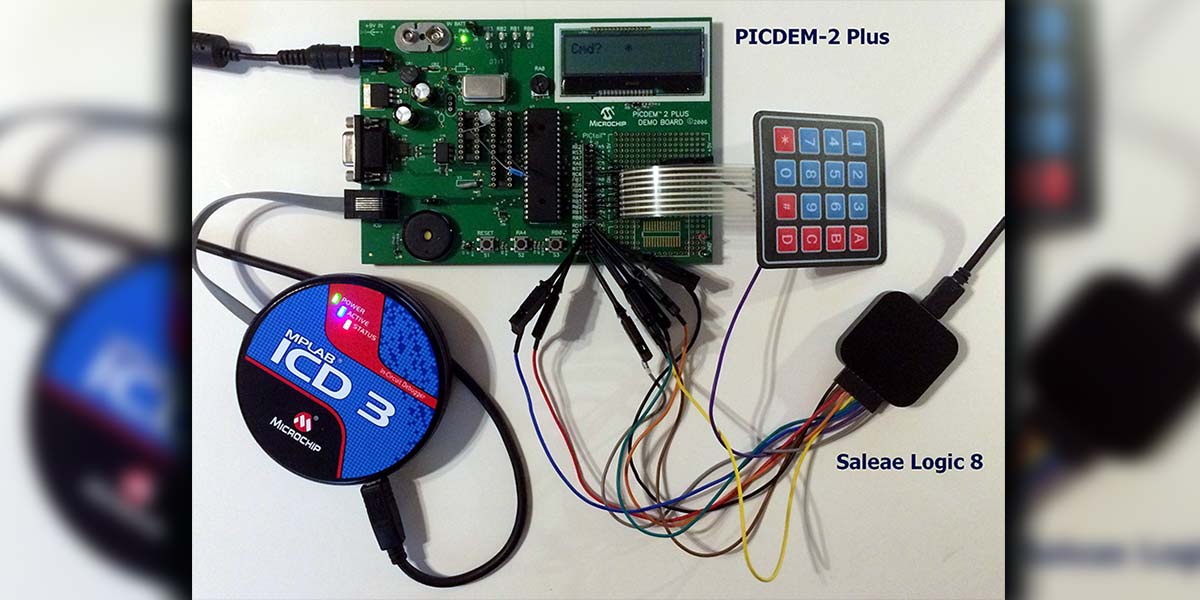
When an IDE hides the mechanics of memory management or when a kernel panic leaves no GUI to inspect, command-line debuggers become the primary interface. Tools like GDB, LLDB, and WinDbg provide direct access to CPU registers, raw memory dumps, and instruction streams. They are indispensable for kernel-mode development, embedded systems, and performance-critical applications where overhead from graphical interfaces can alter timing or obscure low-level state.
GNU Debugger (GDB)
GDB remains the standard for C and C++ development on Linux and Unix-like systems. Its strength lies in its ability to attach to running processes and analyze core dumps generated by segmentation faults or other crashes. For embedded work, GDB pairs with OpenOCD or JTAG adapters to halt execution on target hardware. It supports complex breakpoint conditions and scriptable automation via its Command Line Interface, making it suitable for automated test suites that need to verify state at specific instruction boundaries.
LLDB
LLDB is the default debugger for the Clang/LLVM toolchain and serves as the backend for Swift and C/C++ debugging on macOS and iOS. It offers a Python-based scripting environment that integrates tightly with the LLVM infrastructure, allowing for custom inspection commands. LLDB is particularly effective for debugging Swift applications and handling complex type systems. Its architecture is designed to be more modular than GDB, often resulting in faster startup times and better performance when dealing with large symbol tables or massive memory dumps.
WinDbg
WinDbg is the definitive tool for Windows kernel-mode and driver development. Provided as part of the Windows SDK, it excels at analyzing crash dumps (minidumps and full dumps) to trace the exact state of the system at the moment of failure. It includes specialized extensions like !analyze -v that automatically parse common exception codes and stack traces. For live debugging, WinDbg can connect to remote machines via serial or network connections, allowing developers to inspect kernel structures, driver objects, and memory pools on a target system without interrupting normal operations.
Browser and API debugging utilities
Frontend and API debugging require specialized environments that operate outside the traditional IDE. While your editor handles syntax and logic, the browser and API clients manage network requests, rendering, and state hydration. Using the right tools here isolates issues that are invisible in static code analysis.
Chrome DevTools
Chrome DevTools remains the standard for frontend debugging. It provides direct access to the Document Object Model (DOM), network traffic, and performance metrics. The Elements panel allows you to inspect and modify CSS in real time, while the Console captures JavaScript errors and logs. For performance profiling, the Performance tab records frame rates and script execution, helping you identify bottlenecks in rendering or heavy computations.
The Network tab is particularly critical for debugging loading issues. It displays every resource request, including status codes, timing, and payload size. You can filter requests by type, replay failed calls, and view response headers to diagnose CORS errors or authentication failures. This visibility is essential for understanding how your application interacts with external services.
Postman for REST APIs
For API debugging, Postman offers a structured way to test endpoints without writing client code. You can construct requests with specific headers, query parameters, and body payloads, then inspect the response status and data. The collection runner allows you to automate test suites, ensuring that API contracts remain stable across deployments.
Postman’s environment variables simplify testing across different stages. You can switch between development, staging, and production configurations without altering the request structure. The response body viewer supports JSON formatting, making it easier to parse complex data structures. For backend developers, this tool bridges the gap between server logic and frontend consumption, allowing rapid iteration on API design.
Comparison of Browser vs. API Tools
Choosing between browser and API tools depends on where the failure occurs. Browser tools excel at visual and client-side logic issues, while API tools focus on data exchange and server responses. Using both in tandem provides complete coverage of the request-response cycle.
| Tool | Primary Focus | Key Feature |
|---|---|---|
| Chrome DevTools | Frontend & Network | DOM Inspection & Performance Profiling |
| Postman | API & Data | Request Automation & Environment Variables |
Choosing the right debugging tools for your stack
Selecting the right debugging tools requires aligning language support, environment constraints, and team familiarity. There is no single solution that works for every stack. You need to evaluate your specific workflow to avoid friction during development.
Native IDE debuggers like Visual Studio for C# or PyCharm for Python offer the deepest integration. They provide advanced features like live variable inspection and hot-reloading. For web development, VS Code combined with Chrome DevTools is the standard for JavaScript and TypeScript.
Remote debugging is essential for server-side and embedded systems. Tools like LLDB and GDB handle low-level memory analysis and core dumps. For Windows kernel development, WinDbg remains the industry standard for analyzing crash dumps and driver issues.
Adoption speed matters more than feature count. If your team already uses IntelliJ for Java, adding a separate CLI debugger creates context switching. Stick to tools that integrate with your existing CI/CD pipeline to maintain velocity.
-
Native language support
-
Remote debugging capability
-
Low performance overhead
-
Team familiarity
A ComparisonTable below summarizes the best tools for common scenarios. Use this to quickly identify which tool fits your current project constraints.
| Tool | Best For | Language |
|---|---|---|
| Visual Studio Code | Web & General Purpose | JavaScript, Python, C++ |
| Chrome DevTools | Frontend & API | JavaScript, HTML, CSS |
| WinDbg | Windows Kernel & Drivers | C, C++ |
| PyCharm Debugger | Python Applications | Python |
| GDB | Linux & Embedded | C, C++, Go |
Frequently asked questions about debugging tools
Is VS Code a debugging tool?
Visual Studio Code is not a standalone debugger but an integrated development environment (IDE) with robust, built-in debugging capabilities. It natively supports debugging for JavaScript, TypeScript, and Node.js applications. For other languages and runtimes, developers can install extensions from the Visual Studio Marketplace to enable step-through execution, breakpoint management, and variable inspection. This extensibility makes VS Code a central hub for debugging across multiple tech stacks without leaving the editor.
What are the four core debugging techniques?
Effective debugging follows a systematic process rather than random code changes. Research identifies four key phases: first, observing the failure to understand the symptoms; second, locating the fault by narrowing down the code section causing the issue; third, fixing the fault by implementing a code correction; and finally, verifying the fix to ensure the issue is resolved and no new bugs were introduced. This structured approach reduces time spent on trial-and-error fixes.
What is the difference between a debugger and a linter?
A debugger is a runtime tool that allows you to pause execution, inspect variables, and step through code line-by-line to find logical errors or crashes. A linter is a static analysis tool that scans code for syntax errors, style violations, and potential bugs before the code runs. Debuggers help you understand how your code behaves during execution, while linters help you catch mistakes early in the writing process.
Recommended debugging tools and gear
Selecting the right debugging environment requires balancing software capabilities with physical hardware needs. For software, Visual Studio Code remains the standard for general-purpose development due to its extensive extension ecosystem, while Chrome DevTools is essential for frontend work. For low-level embedded systems, GDB and LLDB provide the necessary control over memory and execution flow.
Hardware debugging often demands specific interfaces to communicate with target devices. A reliable USB-to-JTAG adapter, such as the Segger J-Link or the ST-Link/V2, is critical for flashing firmware and stepping through code on microcontrollers. These tools bridge the gap between your IDE and the silicon.
For developers working with networked applications or APIs, dedicated hardware sniffers can capture traffic without altering the host system. Additionally, having a dedicated debugging keyboard with programmable macro keys can streamline breakpoint management during long sessions.


As an Amazon Associate, we may earn from qualifying purchases.

No comments yet. Be the first to share your thoughts!