Choosing the right debugging tools
Selecting the right debugging tools in 2026 requires looking beyond simple code inspection. The landscape has shifted toward AI-integrated environments that predict errors before they compile, yet traditional CLI tools remain essential for low-level system debugging. The best approach matches specific stack requirements with the right blend of automation and manual control.
Modern developers need tools that understand context. An AI-powered IDE can suggest fixes based on entire project structures, not just the current file. However, for complex memory leaks or race conditions, a debugger that allows step-by-step execution through assembly code is often more reliable than an automated suggestion.
When evaluating options, prioritize tools that integrate seamlessly with your existing workflow. A powerful debugger that requires a separate license or a steep learning curve may slow down your team more than it helps. Look for IDEs that offer built-in debugging capabilities alongside optional AI assistants, allowing you to choose the level of automation you need for each task.
IDE-integrated debugging tools
The most efficient debugging workflow happens inside the editor. These tools eliminate context switching by combining step-through execution with AI-powered code review. This section reviews the leading IDEs that offer robust built-in debugging and AI features, focusing on developer experience and speed.
Visual Studio Code
VSCode remains the dominant choice for web and scripting languages. Its lightweight architecture allows for rapid startup, while the integrated debugger supports breakpoints, variable inspection, and call stacks natively. The ecosystem of extensions enables deep integration with AI assistants that can explain errors or suggest fixes directly in the editor.
IntelliJ IDEA
For Java and Kotlin developers, IntelliJ IDEA provides a sophisticated debugger that understands complex object graphs. The IDE’s AI assistant, Codeium, integrates with the debugging session to offer context-aware suggestions. The debugger can evaluate expressions in real-time, helping developers understand state changes without restarting the application.
Visual Studio
Visual Studio offers a powerful debugger for .NET, C++, and Python. The IntelliTrace feature records execution history, allowing developers to rewind through code to find the root cause of a bug. The integrated AI features assist in code review, highlighting potential issues and suggesting optimizations based on the current codebase.
| IDE | Debugging Strength | AI Integration | Best For |
|---|---|---|---|
| VSCode | Strong extension support | Extensive marketplace | Web, JS, Python |
| IntelliJ IDEA | Advanced object inspection | Built-in Codeium | Java, Kotlin |
| Visual Studio | IntelliTrace history | Copilot integration | .NET, C++ |
Essential command-line debuggers
While AI-powered IDEs excel at refactoring and high-level logic, they often hit a wall when dealing with memory corruption, kernel panics, or complex race conditions. For low-level debugging, command-line interfaces (CLIs) remain the industry standard. They provide the direct, unfiltered access to process memory and CPU registers that graphical overlays simply cannot replicate.
GDB and LLDB
GNU Debugger (GDB) and its LLVM counterpart, LLDB, are the backbone of C, C++, and Rust debugging on Linux and macOS. GDB’s extensive scripting capabilities allow developers to automate complex inspection workflows, while LLDB offers a more modern, extensible architecture. Both tools enable you to step through assembly, inspect raw memory dumps, and attach to live processes without the overhead of a full IDE environment. They are indispensable for performance profiling where every millisecond counts.
WinDbg
For Windows development, WinDbg is the definitive tool for analyzing crash dumps and debugging kernel-mode drivers. Part of the Windows Driver Kit (WDK), it offers sophisticated features like live kernel debugging and memory analysis that go far beyond standard user-mode breakpoints. WinDbg’s ability to parse complex dump files makes it essential for diagnosing system-level crashes that IDEs typically cannot interpret. Its integration with the broader Windows debugging ecosystem ensures it remains the primary choice for low-level Windows development.
AI code review and error tracking
Traditional debugging often feels like searching for a needle in a haystack, but AI-powered platforms are turning that haystack into a sorted index. Tools like Sentry have shifted the paradigm from reactive patching to proactive root cause analysis. Instead of waiting for users to report vague bug descriptions, these systems capture the exact state of the application at the moment of failure, providing developers with a reproducible context rather than a static stack trace.
The integration of machine learning allows these platforms to cluster similar errors and suggest likely causes based on recent code changes. This reduces the time spent on triage, allowing engineers to focus on fixing the logic rather than hunting for the source. For teams using AI-powered IDEs, this external context bridges the gap between local development and production behavior, ensuring that the fixes implemented locally actually resolve the live issues.
To get the most out of these integrations, consider auditing your current error reporting pipeline against the following criteria:
- Verify that stack traces include relevant variable states and user context.
- Check if the tool automatically clusters duplicate errors to reduce noise.
- Ensure the platform integrates with your existing CI/CD workflow for immediate feedback.
- Confirm that the AI suggestions are grounded in actual code diffs, not generic advice.
Best debugging tools for your stack
Choosing the right debugging environment depends heavily on the language and framework you are building with. Modern AI-powered IDEs have become the standard for catching errors early, offering intelligent code completion and root-cause analysis that reduces time spent on trivial mistakes. Below are the top recommendations for the most common technology stacks.
Web and Frontend Development
For web developers, the browser’s built-in developer tools remain the most immediate way to inspect the DOM, monitor network requests, and trace JavaScript execution. Chrome DevTools provides a robust suite for frontend debugging that requires no additional installation. When building larger applications, Visual Studio Code (VSCode) has become the default editor, supported by a vast ecosystem of extensions that integrate seamlessly with these browser tools.
Python and Data Science
Python developers benefit from specialized debuggers that handle the language’s dynamic nature. PyCharm’s debugger offers deep integration with the IDE, allowing for conditional breakpoints and variable evaluation without leaving the editor. For those working in Jupyter Notebooks, the interactive kernel provides a unique debugging experience, letting you inspect state at every cell execution. This environment is particularly useful for data science workflows where understanding data transformation at each step is critical.
Mobile and Cross-Platform
Mobile app development requires tools that can simulate device behavior and track performance on both iOS and Android. Sentry is highly recommended for automated error root cause tracking, capturing crashes and providing stack traces that help developers understand context before a user even reports an issue. Instabug complements this by allowing testers to report bugs directly from the device, including screenshots and log files, which speeds up the feedback loop significantly.
Hardware and Embedded Systems
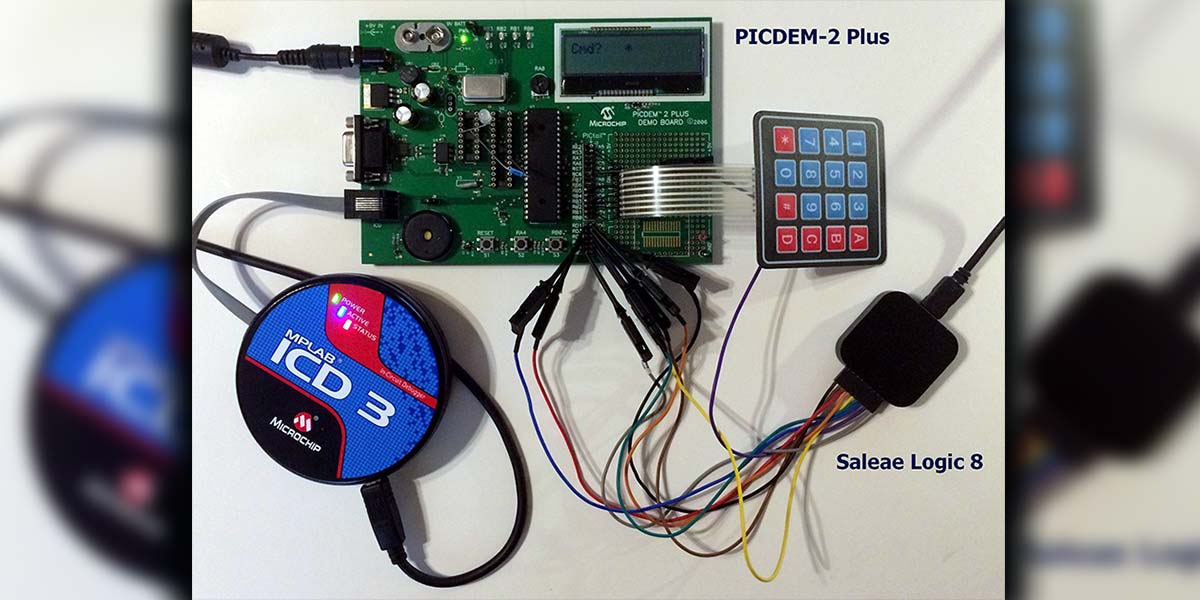
Debugging embedded systems often involves hardware-level interaction. Intel-based debugging tools, such as those found in the Intel® Platform Debugging Tools suite, provide essential support for low-level firmware and driver development. These tools allow developers to inspect memory, set hardware breakpoints, and trace instruction execution, which is indispensable for performance optimization and error resolution in resource-constrained environments.

As an Amazon Associate, we may earn from qualifying purchases.
No comments yet. Be the first to share your thoughts!