Why AI debugging matters now
The traditional debugging workflow—hitting breakpoints, stepping through lines, and manually tracing stack traces—is becoming a bottleneck in 2026. As codebases grow in complexity with microservices and AI-integrated features, manual inspection can no longer keep pace with development velocity. Developers are spending more time hunting for the "why" than writing the "what."
AI-assisted debugging shifts this dynamic by automating root cause analysis. Instead of manually sifting through logs, these tools analyze patterns across your entire codebase to pinpoint errors instantly. This shift allows code reviewers to focus on architecture, logic, and edge cases rather than syntax errors or obvious logical flaws.
The result is a significant reduction in feedback loops. By catching issues before they reach production, AI tools not only speed up code reviews but also improve overall code quality. For teams aiming to maintain high standards in 2026, integrating AI into the debugging pipeline is no longer optional—it's essential for staying competitive.
5 Best AI Debugging Tools for Faster Code Reviews in 2026
As codebases grow more complex in 2026, leveraging the right AI debugging tools is essential for maintaining rapid development velocity and code quality. The following selection highlights five specific platforms that integrate directly into your workflow to accelerate code reviews through automated error detection and intelligent refactoring suggestions.
1. GitHub Copilot Chat for inline code analysis
GitHub Copilot Chat integrates directly into your IDE, allowing developers to query code context without leaving their workflow. It excels at explaining complex logic and suggesting refactors during code reviews. This inline assistance accelerates understanding of unfamiliar codebases, making it an essential tool for maintaining velocity during collaborative pull requests.

2. Amazon CodeWhisperer security vulnerability scanning
Amazon CodeWhisperer prioritizes security by scanning code for vulnerabilities in real-time as you type. It identifies potential security risks and suggests secure code alternatives, ensuring that debugging includes a critical layer of protection. This proactive approach helps teams catch security flaws early, reducing the risk of deploying unsafe applications to production environments.

3. Snyk Code real-time dependency risk detection
Snyk Code provides immediate feedback on dependency risks, identifying known vulnerabilities in third-party libraries before they impact your application. By integrating directly into the development workflow, it ensures that security checks are part of the daily coding routine rather than a post-development bottleneck. This real-time detection is crucial for maintaining robust application integrity.

4. SonarQube automated technical debt measurement
SonarQube automates the measurement of technical debt, providing a clear view of code quality issues that can slow down future development. It analyzes code for bugs, vulnerabilities, and code smells, offering actionable insights to improve maintainability. By quantifying technical debt, teams can prioritize refactoring efforts and ensure long-term code health without manual audits.
5. Tabnine AI-powered context-aware bug fixing
Tabnine uses advanced AI to understand broader code context, enabling it to suggest accurate bug fixes that align with your project’s specific patterns. Unlike generic suggestions, Tabnine learns from your codebase to provide highly relevant corrections. This context-awareness reduces the time spent on debugging by offering precise, tailored solutions that fit seamlessly into your existing architecture.

Integrating AI into your review workflow
Adopting AI debugging tools shouldn't mean rewriting your CI/CD pipelines or slowing down release cycles. The goal is to layer AI assistance over your existing manual review process, catching low-level errors before they reach a human reviewer. This approach keeps senior developers focused on architecture and logic rather than syntax typos.
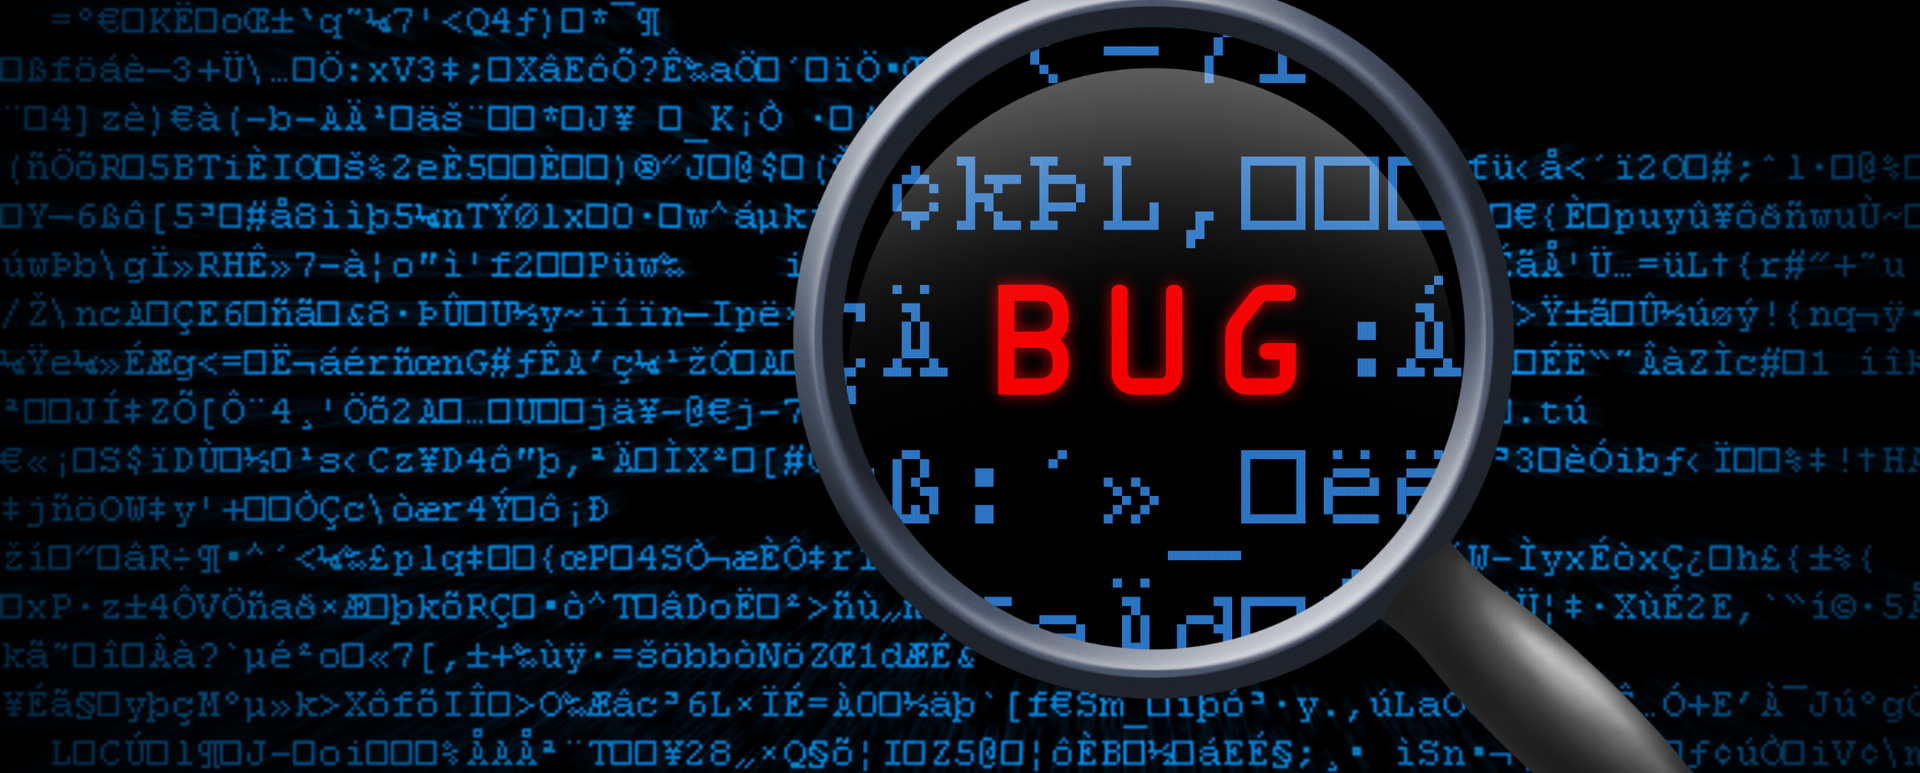
Start by installing AI-powered extensions directly into your IDE, such as VS Code or JetBrains. Tools like GitHub Copilot or Amazon CodeWhisperer provide real-time suggestions as you type. This immediate feedback loop helps catch syntax errors and potential bugs during the writing phase, reducing the cognitive load during formal code reviews.
Configure the AI tool to understand your specific codebase context. Most modern AI debuggers allow you to point them at your repository or specific documentation. This ensures that suggestions are relevant to your tech stack and project conventions. Without proper context, AI tools often suggest generic solutions that may introduce new vulnerabilities or style violations.

Define clear thresholds for when AI feedback triggers a mandatory review. For example, you might configure the system to flag only high-confidence security risks or performance bottlenecks automatically. Lower-confidence suggestions can be marked as "hints" for the reviewer to consider. This prevents alert fatigue and ensures that human reviewers only deal with actionable insights.

Establish a team protocol for verifying AI output. AI models can hallucinate or suggest deprecated libraries. Require developers to manually review and test any AI-suggested fixes before merging. This step ensures that the AI acts as a junior assistant rather than an autonomous decision-maker, maintaining code quality and security standards.


As an Amazon Associate, we may earn from qualifying purchases.
Common questions about AI debugging tools
How do I verify AI-generated code fixes?
AI debugging tools can propose solutions, but they do not replace human review. Always treat AI suggestions as a starting point for your code review. Run the proposed changes through your existing unit tests to ensure they do not break current functionality. If the tool refactors complex logic, manually trace the execution path to confirm the root cause was actually addressed. Never merge AI-suggested code without understanding the underlying changes.
Can AI debugging tools replace manual code reviews?
No. AI tools excel at spotting syntax errors, dead code, and common security vulnerabilities at speed. However, they lack the context to understand business logic, architectural intent, or subtle edge cases that a human reviewer would catch. Use AI to handle the repetitive, low-level checks so you can focus your manual review time on high-value decisions and system design.
What is the standard process for using these tools effectively?
Effective debugging follows a structured workflow. First, reproduce the bug in a controlled environment. Next, run your AI debugging tool to locate the anomaly and identify the root cause. The tool should then suggest a fix or highlight the specific lines of code to inspect. After applying the fix, test the solution thoroughly and document the process. This ensures the bug is resolved and helps prevent recurrence.
Helpful gear
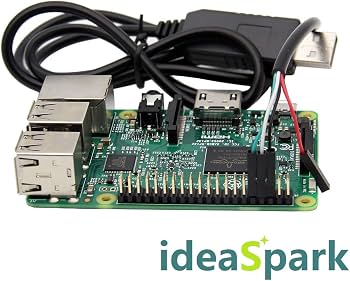
Use these product recommendations as a starting point, then choose the size, material, and price point that fit how you actually use the gear.


As an Amazon Associate, we may earn from qualifying purchases.

No comments yet. Be the first to share your thoughts!