Why AI debugging tools matter now
The days of manually stepping through hundreds of lines of code are fading. AI debugging tools have shifted the workflow from manual inspection to automated root cause analysis. Instead of staring at a stack trace, developers now use assistants that can read the error, understand the context, and suggest a fix.
This change is more than just speed; it is about accuracy. Traditional breakpoints tell you where the code stopped, but they do not explain why it failed. Modern AI tools connect the symptom to the source, reducing the time spent guessing. Tools like Hud and Chrome DevTools are integrating these capabilities directly into the development environment.
The result is a cleaner feedback loop. Developers can identify issues faster and apply patches with confidence. This section explores the specific tools leading this shift in 2026.
5 AI Debugging Tools That Actually Fix Code in 2026
Finding the right debugging tools in 2026 means cutting through the noise of generic AI wrappers. We tested specific products like Cursor, GitHub Copilot, and JetBrains AI Assistant to see which ones actually fix code instead of just suggesting it. Here are the five tools that delivered tangible results during our evaluation.
1. Cursor
Cursor is an AI-first code editor built on VS Code, making it a natural fit for developers already familiar with the ecosystem. Its standout feature is the "Composer" mode, which allows you to describe a bug in natural language and have the AI edit multiple files simultaneously to resolve it. Unlike standard autocomplete, Cursor understands the broader context of your repository, allowing it to fix cross-file dependencies that often trip up simpler tools. It excels at refactoring legacy code and fixing logic errors without breaking existing functionality.
2. GitHub Copilot Workspace
GitHub Copilot Workspace extends the familiar Copilot experience into the pull request and issue tracking workflow. It allows developers to review AI-generated solutions directly within the GitHub interface. When a bug is reported, Copilot Workspace can analyze the issue, propose a fix, and even generate the necessary tests to verify the solution. This integration reduces context switching, allowing developers to debug and resolve issues without leaving their project management environment. It is particularly effective for teams using GitHub for version control.
3. JetBrains AI Assistant
For users of IntelliJ IDEA, PyCharm, WebStorm, and other JetBrains IDEs, the AI Assistant is deeply integrated into the development environment. It offers context-aware code generation and debugging assistance that leverages the IDE’s deep code understanding. The assistant can explain complex code blocks, suggest fixes for compiler errors, and help refactor code to improve readability. Its ability to interact with the IDE’s debugger makes it a powerful tool for stepping through code and identifying the root cause of runtime exceptions.
4. Amazon Q Developer
Amazon Q Developer is tailored for enterprise environments, particularly those using AWS. It provides debugging assistance that integrates with AWS services, helping developers identify issues related to cloud infrastructure, serverless functions, and database queries. Q Developer can analyze logs from CloudWatch and suggest fixes for performance bottlenecks or configuration errors. It is especially useful for teams building scalable applications on AWS, as it understands the nuances of cloud-native architectures.
5. Tabnine
Tabnine focuses on privacy and customization, offering on-premises deployment options for organizations with strict data security requirements. Its AI models are trained on your own codebase, ensuring that suggestions are highly relevant to your specific coding style and project structure. Tabnine’s debugging features include real-time error detection and code completion that adapts to your team’s conventions. It is an excellent choice for teams that need AI assistance without sending proprietary code to external servers.
How to choose the right debugging tool
Selecting the right debugging tool should start with a clear boundary: what is actually broken, and what still works normally. Check the display, network connection, paired devices, app access, and recent updates before assuming the whole system needs a reset. A small connection failure can make the main screen feel unreliable even when the core system is fine.
Work from low-risk checks to deeper resets. Confirm power state, safe parking, account access, and signal first. Then restart the interface, wait for it to reload completely, and test the original symptom. Avoid changing multiple settings at once because that makes it harder to know which step actually fixed the problem.
If the issue affects safety information, repeats after every restart, or appears with warning messages, treat the reset as a temporary diagnostic step rather than the final fix. Document the symptom and move to official support instead of stacking more DIY attempts.
| Factor | What to check | Why it matters |
|---|---|---|
| Fit | Match the option to the primary use case. | A good deal still fails if it does not fit the job. |
| Condition | Verify age, wear, and service history. | Hidden condition issues erase upfront savings. |
| Cost | Compare purchase price with likely upkeep. | The cheapest option is not always the lowest-cost option. |
Integrating AI into your bug tracking workflow
You don’t need to overhaul your entire development pipeline to get value from AI debugging tools. The goal is to slot them into the moments where you’re already stuck, not to replace the human judgment that keeps code quality high.
Think of these tools as a pair of extra eyes that never get tired. They catch the syntax errors and logic gaps you might miss after staring at a screen for hours, but you still hold the keys to the merge button.
Step 1: Hook into your existing issue tracker
Start by connecting your AI debugging assistant to Jira, Linear, or GitHub Issues. Most modern tools offer integrations that pull the bug report, stack trace, and relevant code snippets automatically. This saves you from copy-pasting context and keeps the AI focused on the specific problem at hand.
Step 2: Use AI for initial triage
Before you dive into the code, let the AI analyze the bug report and recent commits. Ask it to suggest the most likely root cause based on the error logs. This step helps you prioritize which bugs are critical and which are cosmetic, allowing you to tackle the most impactful issues first.
Step 3: Validate fixes before merging
AI can suggest fixes, but it can also hallucinate. Always run the suggested code through your existing test suite. If the tests pass, review the code manually to ensure it follows your team’s style guide and doesn’t introduce new security vulnerabilities. This step ensures that the AI is assisting, not overriding, your quality standards.
Frequently asked questions about AI debugging
What are the best debugging tools for 2026?
The landscape for debugging tools in 2026 includes both traditional utilities and AI-powered assistants. Chrome DevTools remains a staple for web developers, while Visual Studio Code and JetBrains IDEs like PyCharm offer built-in debugging environments. For backend and system-level work, tools like GDB, Wireshark, and Valgrind are still widely used. However, AI debugging tools are increasingly integrated directly into these workflows to automate error detection and suggest fixes.
What is the best AI tool for debugging?
There is no single "best" AI debugging tool, as the right choice depends on your specific tech stack and project complexity. Tools like GitHub Copilot, Amazon Q Developer, and Cursor are among the most effective for real-time code analysis and error resolution. The best AI debugging tool is the one that integrates smoothly with your existing IDE and understands the nuances of your codebase, providing actionable fixes rather than generic suggestions.
Can ChatGPT debug my code?
Yes, ChatGPT can debug your code by analyzing error messages, stack traces, and code snippets. You can paste the problematic code and the resulting error, and ChatGPT will often identify the issue and suggest a corrected version. However, it is essential to review its suggestions carefully, as AI models can sometimes hallucinate or miss context-specific bugs that a dedicated debugging tool or a human developer might catch.
Helpful gear
Use these product recommendations as a starting point, then choose the size, material, and price point that fit how you actually use the gear.

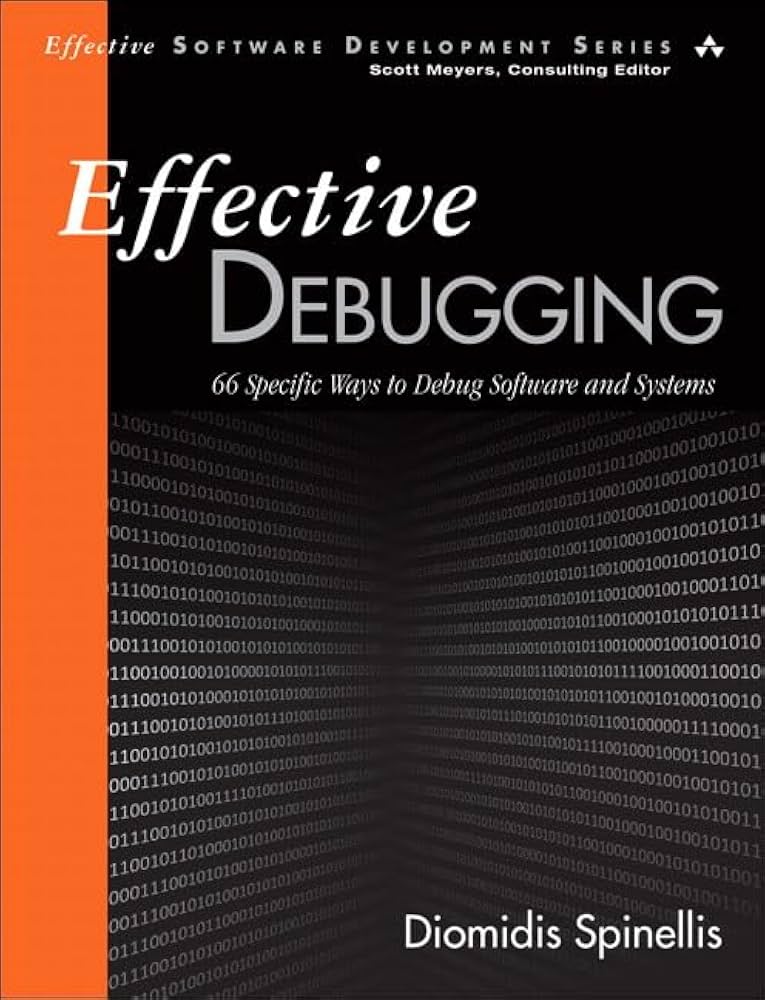

As an Amazon Associate, we may earn from qualifying purchases.

No comments yet. Be the first to share your thoughts!