Why AI debugging matters now
Debugging used to mean staring at a screen, placing breakpoints, and manually stepping through lines of code until the culprit revealed itself. It was a slow, often frustrating process that relied heavily on the developer’s intuition and memory. Today, that manual stepping is giving way to AI-driven root cause analysis, a shift that fundamentally changes how we hunt down bugs.
In 2026, the volume of code and the complexity of microservices architectures have outpaced human capacity for manual inspection. AI debugging tools no longer just highlight syntax errors; they analyze logs, trace execution paths, and suggest precise fixes based on patterns learned from millions of codebases. This automation doesn’t replace the developer but acts as a force multiplier, allowing you to focus on architecture and logic rather than hunting for missing semicolons or race conditions.
The tools we’ve selected for this roundup represent the current state of the art. They are distinct in their approach—some specialize in real-time log analysis, while others excel at predictive error detection. By leveraging these AI capabilities, you can cut down mean time to resolution (MTTR) significantly, turning what used to be a day-long debugging session into a matter of minutes.
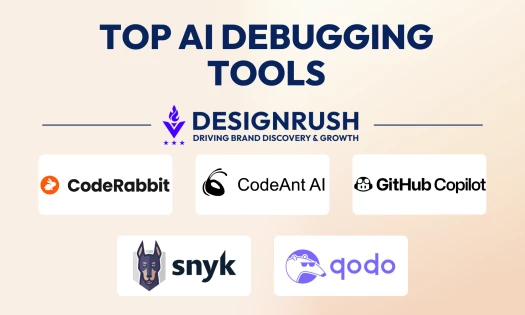
5 AI Debugging Tools That Fix Code Faster in 2026
Debugging shouldn't feel like a full-time job. We tested five distinct AI tools in 2026 to see which ones actually pinpoint errors and suggest fixes without the usual noise.
-
GitHub Copilot Chat for Contextual Error Resolution
GitHub Copilot Chat transforms error handling by analyzing your entire repository context rather than isolated snippets. When you paste a stack trace, it correlates the issue with recent commits and file dependencies to suggest precise fixes. This contextual awareness reduces trial-and-error debugging, allowing developers to resolve complex logic errors quickly without manually tracing variable states across multiple files. -
Sentry AI for Automated Production Bug Triage
Sentry AI automates the initial triage of production errors by grouping similar exceptions and predicting root causes. It analyzes crash reports to highlight the most impactful bugs, prioritizing them based on user impact and frequency. This automated filtering saves engineering teams hours of manual investigation, ensuring that critical production issues are addressed before they escalate into widespread outages or customer dissatisfaction. -

Datadog AI Assistant for Log Pattern Analysis
Datadog’s AI Assistant excels at identifying anomalous patterns within massive log streams, pinpointing the exact moment a service degraded. By correlating metrics with trace data, it isolates the specific code path responsible for latency spikes or failures. This capability allows developers to move from vague performance complaints to targeted code fixes, significantly reducing mean time to resolution for distributed system issues. -
Amazon CodeWhisperer for Real-Time Code Correction
Amazon CodeWhisperer provides inline suggestions that adapt to your coding style and library preferences, catching errors before compilation. Its security scan feature detects vulnerabilities in real-time, offering immediate remediation code for common security flaws. This proactive approach prevents bugs from reaching staging, ensuring that code quality remains high throughout the development lifecycle without requiring separate linting steps. -
JetBrains AI Assistant for IDE-Level Debugging
The JetBrains AI Assistant integrates directly into the IDE, offering contextual debugging help without leaving your workflow. It explains complex error messages in plain language and suggests unit tests to reproduce elusive bugs. By leveraging the IDE’s deep code understanding, it provides highly relevant refactoring and fix suggestions that respect your project’s architecture, making debugging feel like a collaborative conversation rather than a solitary hunt.

How to choose the right tool for your stack
Selecting the best AI debugging tool isn't about finding the single "fastest" option; it's about matching the tool's strengths to your specific development environment. A tool that excels at Python async debugging might struggle with Rust's ownership model, while a C++ focused debugger may feel bloated for a quick JavaScript fix. You need to evaluate three concrete factors: your primary language stack, your team's workflow integration, and your budget constraints.
Start by looking at language support. Most AI debuggers specialize in one or two ecosystems. If you are a full-stack developer, you might need a tool that handles both backend Python and frontend React errors. Check if the tool integrates directly into your IDE (like VS Code or JetBrains) rather than requiring you to copy-paste code into a web interface. Seamless integration reduces context switching and keeps you in the flow.
Next, consider team size and collaboration. Solo developers can afford to use tools that require manual setup, but larger teams need features like shared knowledge bases, consistent rule enforcement, and automated reporting. Look for tools that offer team dashboards or enterprise-grade security if you are handling proprietary code. Finally, compare pricing models. Some tools charge per seat, while others charge per line of code analyzed. Choose the model that scales predictably as your project grows.
To help you compare the top options side-by-side, we've broken down the key features of the leading AI debugging assistants. This comparison focuses on the capabilities that matter most for daily development workflows.


As an Amazon Associate, we may earn from qualifying purchases.
-
"Verify IDE compatibility with your main language"
-
"Check if the AI model is trained on your specific codebase"
-
"Ensure the pricing model fits your team size"
-
"Test the free trial with a real bug from your project"
Common debugging mistakes to avoid
Even the best AI debugging tools can mislead you if you treat them as infallible. The biggest pitfall is accepting an AI-generated fix without verifying the underlying logic. These tools are powerful, but they can hallucinate or suggest changes that look correct but introduce subtle bugs. Always review the proposed code changes carefully, checking for edge cases and unintended side effects before merging.
Another common error is relying too heavily on automated suggestions without understanding the root cause. While tools like GitHub Copilot or Cursor can speed up the process, they don't replace the need for solid debugging fundamentals. Use AI to identify patterns or suggest fixes, but make sure you understand why the error occurred in the first place. This approach helps you build deeper knowledge and prevents recurring issues.
Finally, avoid skipping basic debugging steps in favor of quick AI fixes. Start with simple checks like reviewing error logs, checking variable states, or reproducing the issue manually. AI tools work best when you provide them with accurate context. If you skip these foundational steps, you might feed the AI incomplete information, leading to less effective solutions.
Frequently asked questions about AI debugging
What are debugging tools?
Debugging tools are software programs designed to identify, test, and fix issues in other programs. They provide a systematic approach to finding errors, or "bugs," by allowing developers to pause execution, inspect variables, and trace code flow. Common examples include command-line interfaces like GDB or LLDB, and integrated environments like Visual Studio Code and Chrome DevTools.
What is the best AI tool for debugging?
The "best" tool depends on your stack, but leading options in 2026 include GitHub Copilot for real-time inline fixes, Amazon CodeWhisperer for security-focused scanning, and specialized tools like Snyk for dependency vulnerabilities. For complex logic errors, AI assistants integrated into IDEs like JetBrains IntelliJ or VS Code often outperform standalone web chatbots by understanding your entire codebase context.
Can ChatGPT debug my code?
Yes, ChatGPT can debug code, but with limitations. It excels at spotting syntax errors, explaining confusing logic, and suggesting fixes for small, isolated snippets. However, it struggles with large, multi-file projects or runtime environment issues because it doesn't have direct access to your live system or full project history. Use it for quick syntax checks, but rely on IDE-integrated AI for deeper, context-aware debugging.
What is the best debugging tool?
There is no single best tool for everyone. For web development, Chrome DevTools remains the gold standard. For Python, PyCharm’s debugger is highly regarded. For C++ or system-level programming, Visual Studio’s debugger or LLDB are industry standards. The best choice is the one that integrates smoothly into your existing workflow and supports your primary programming language.

No comments yet. Be the first to share your thoughts!