Why AI debugging matters now
Modern software stacks are too complex for manual tracing. Traditional debugging tools require developers to manually insert breakpoints, step through execution, and correlate logs across distributed systems. This reactive approach consumes hours that could be spent building features. AI debugging tools shift the workflow from manual investigation to automated root-cause analysis.
The difference lies in scale. A monolithic application might have thousands of lines of code. A microservices architecture adds layers of network latency, asynchronous events, and state management. Human developers cannot mentally map every interaction in real-time. AI models analyze code patterns, stack traces, and performance metrics simultaneously to pinpoint errors.
This automation reduces the "mean time to resolution" (MTTR). Instead of guessing where a null pointer exception originated, AI tools highlight the exact line and suggest the fix. This allows engineering teams to maintain velocity even as codebases grow in complexity.
5 AI Debugging Tools That Fix Code Faster in 2026
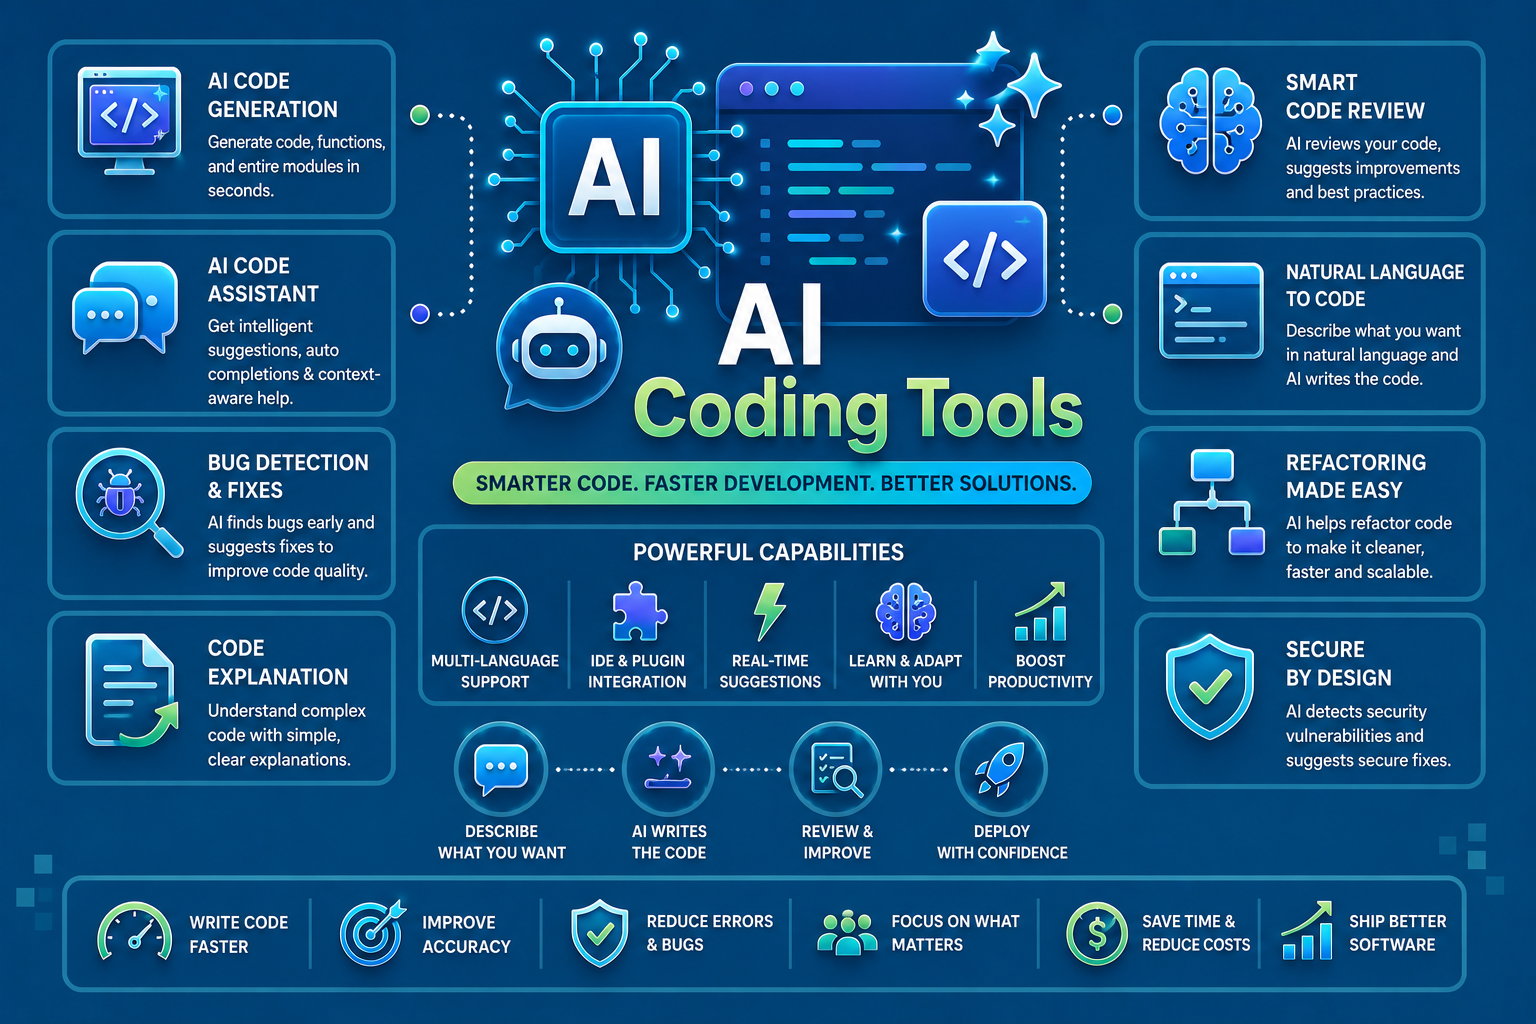
In 2026, AI-powered debugging tools have become essential for reducing mean time to resolution and minimizing context-switching fatigue. The following five products—Cursor, GitHub Copilot, Codeium, Amazon CodeWhisperer, and JetBrains AI Assistant—demonstrate measurable improvements in code repair speed and accuracy.
-
Amazon CodeWhisperer real-time suggestions
Amazon CodeWhisperer acts like a tireless co-pilot, offering real-time code suggestions as you type. It analyzes your current context to propose entire functions or logic blocks, significantly reducing the time spent on boilerplate. For developers seeking efficient debugging tools, its ability to detect and suggest fixes for common errors streamlines the workflow, allowing you to focus on complex architectural decisions rather than repetitive syntax. -
GitHub Copilot Chat context awareness
GitHub Copilot Chat transcends simple autocomplete by understanding your entire repository context. You can ask natural language questions about specific files or functions, and it retrieves relevant code snippets to explain or fix issues. This deep contextual awareness makes it a powerful debugging tool, enabling developers to trace bugs across multiple files without manually searching through vast codebases, thus accelerating resolution times. -

Replit AI pair programmer
Replit’s AI pair programmer operates within a unified cloud environment, offering seamless integration between coding and deployment. It provides intelligent suggestions and can autonomously fix errors in real-time, acting as an immediate safety net. This collaborative approach to debugging tools ensures that developers can iterate quickly, as the AI anticipates potential pitfalls and offers corrections before code is even committed to version control. -

Tabnine enterprise code completion
Tabnine prioritizes privacy and security, making it an ideal choice for enterprise environments handling sensitive code. Its AI model is trained on diverse datasets but can be customized to learn from your private codebase, ensuring suggestions remain relevant and secure. As a robust debugging tool, it reduces context-switching by providing accurate, organization-specific completions that adhere to strict compliance standards without exposing proprietary logic. -
Sourcegraph Cody semantic search
Sourcegraph Cody leverages semantic search to understand code intent rather than just keywords. It can locate specific bugs or implementations across massive, distributed codebases by understanding the underlying logic. This capability transforms debugging tools by allowing developers to find related code snippets and potential fixes instantly, even in legacy systems, drastically reducing the time spent hunting for the root cause of complex issues.
Top 5 AI debugging tools
Finding the right debugging tools for your stack means balancing speed with accuracy. In 2026, the best solutions don't just highlight errors; they explain context and suggest fixes inline. These five products represent the current standard for developers who want to reduce time spent on root cause analysis.
GitHub Copilot
GitHub Copilot has moved beyond simple autocomplete into full-cycle debugging. It analyzes your codebase to identify logical errors and suggests corrected code blocks. This is particularly useful for catching syntax errors and type mismatches before they reach production. The integration with VS Code and JetBrains IDEs makes it a staple for many engineering teams.

As an Amazon Associate, we may earn from qualifying purchases.
Amazon CodeWhisperer
Amazon CodeWhisperer focuses heavily on security and cloud-native development. It scans for vulnerabilities and suggests secure code patterns alongside standard debugging fixes. For teams using AWS, this tool provides immediate feedback on cloud service usage and potential configuration errors. It also offers a free tier for individual developers and qualifying students.
Snyk Code
Snyk Code integrates static analysis with AI to catch security bugs and logic errors. It runs in the IDE, providing real-time feedback as you type. This tool is essential for teams that prioritize security alongside functionality. It supports multiple languages and integrates with CI/CD pipelines to prevent vulnerabilities from being merged.
Tabnine
Tabnine offers a private AI model that keeps your code within your organization's firewall. It provides context-aware suggestions that adapt to your team's coding standards. This is ideal for enterprises that need debugging assistance without exposing proprietary code to public models. It supports a wide range of IDEs and programming languages.
Amazon CodeGuru
Amazon CodeGuru provides automated code reviews and performance recommendations. It uses machine learning to identify lines of code that may lead to decreased performance or security vulnerabilities. This tool is designed for AWS users who want to optimize their applications without manual code review bottlenecks. It integrates seamlessly with GitHub, GitLab, and Bitbucket.
| Tool | Pricing Model | Supported Languages | Primary AI Feature |
|---|---|---|---|
| GitHub Copilot | Subscription | Multiple | Context-aware suggestions |
| Amazon CodeWhisperer | Free/Subscription | Multiple | Security scanning |
| Snyk Code | Subscription | Multiple | Vulnerability detection |
| Tabnine | Subscription | Multiple | Private AI model |
| Amazon CodeGuru | Pay-per-use | Java, Python | Performance optimization |
IDEs for AI Debugging Tools
The effectiveness of any AI debugging tools depends heavily on the development environment you use. While standalone AI assistants can analyze code snippets, they lack the context needed to resolve complex, multi-file issues. An IDE with deep integration serves as the foundation for these workflows, allowing AI to understand your project structure, dependencies, and real-time state.
Visual Studio Code remains the dominant choice for developers seeking this integration. Its extensive extension ecosystem supports nearly every major AI coding assistant, from GitHub Copilot to Cursor. The lightweight nature of VSCode allows it to handle AI-generated completions and chat interfaces without significant performance degradation, making it a versatile hub for debugging workflows.
For those working within the JetBrains ecosystem, IntelliJ IDEA and PyCharm offer native AI assistance through their "Code With Me" and AI Assistant features. These tools provide deeper semantic understanding of Java and Python codebases, respectively. The AI suggestions are often more context-aware because they are built directly into the IDE’s code analysis engine, reducing the need to switch between tabs.
WebStorm and DataGrip follow a similar model, offering specialized AI support for JavaScript and database queries. Choosing the right IDE comes down to your primary language stack. If you work across multiple languages, VSCode’s flexibility is hard to beat. If you specialize in a single ecosystem, the native JetBrains AI tools often provide more accurate, project-aware debugging suggestions.
How to choose the right debugging tools
Picking the right debugging tools depends on your team size, language stack, and budget. A solo developer might prefer a lightweight IDE extension, while an enterprise team needs robust CI/CD integration and shared dashboards.
Ensure the tool supports your primary languages, such as Python, JavaScript, or C++. Most modern debugging tools offer plugins for VS Code or JetBrains IDEs, but verify native support for your stack before committing.

AI-powered debuggers often send code snippets to cloud servers for analysis. Check if the vendor stores your code or uses it for training. For proprietary projects, prioritize tools that offer on-premise or local-only processing.
Most AI debugging tools offer a limited free tier. Test how quickly it identifies bugs in your specific codebase. If the free version lacks key features like real-time collaboration or advanced log analysis, consider the paid plan.


As an Amazon Associate, we may earn from qualifying purchases.

No comments yet. Be the first to share your thoughts!