Debugging Tools
Finding the right AI-powered debugging tool depends on your stack, budget, and how much automation you trust. We evaluated five leading options for 2026 based on accuracy, integration depth, and real-world performance.
Our selection criteria prioritized tools that actively fix code rather than just flagging errors. We tested each for false-positive rates, support for major languages, and ease of setup. The goal is to help you choose a tool that fits your workflow, not just one with the flashiest marketing.
5 AI-Powered Debugging Tools in 2026: Automate Bug Tracking & Fix Code Faster
The 2026 debugging landscape prioritizes tools that actively fix code rather than just flagging errors. We evaluated five specific products for their ability to automate bug tracking, reduce mean time to resolution, and integrate seamlessly into existing CI/CD pipelines.
1. Amazon CodeWhisperer for real-time code suggestions
CodeWhisperer acts like a pair programmer who reads your mind, offering line-by-line completions in over 20 languages. It integrates directly into IDEs, analyzing your current context to suggest secure, reusable code snippets. This tool excels at reducing boilerplate, allowing developers to focus on complex logic while maintaining high productivity standards during rapid prototyping phases.

2. GitHub Copilot Chat for natural language debugging
GitHub Copilot Chat transforms debugging into a conversational experience, letting you ask questions about your codebase in plain English. It scans your entire repository to provide context-aware answers, helping you understand errors or refactor legacy code efficiently. This natural language interface lowers the barrier for complex troubleshooting, making it easier to isolate bugs without manually sifting through logs.

- Conversational debugging
- Repository-wide context
- Natural language queries
3. JetBrains AI Assistant for IDE-integrated fixes
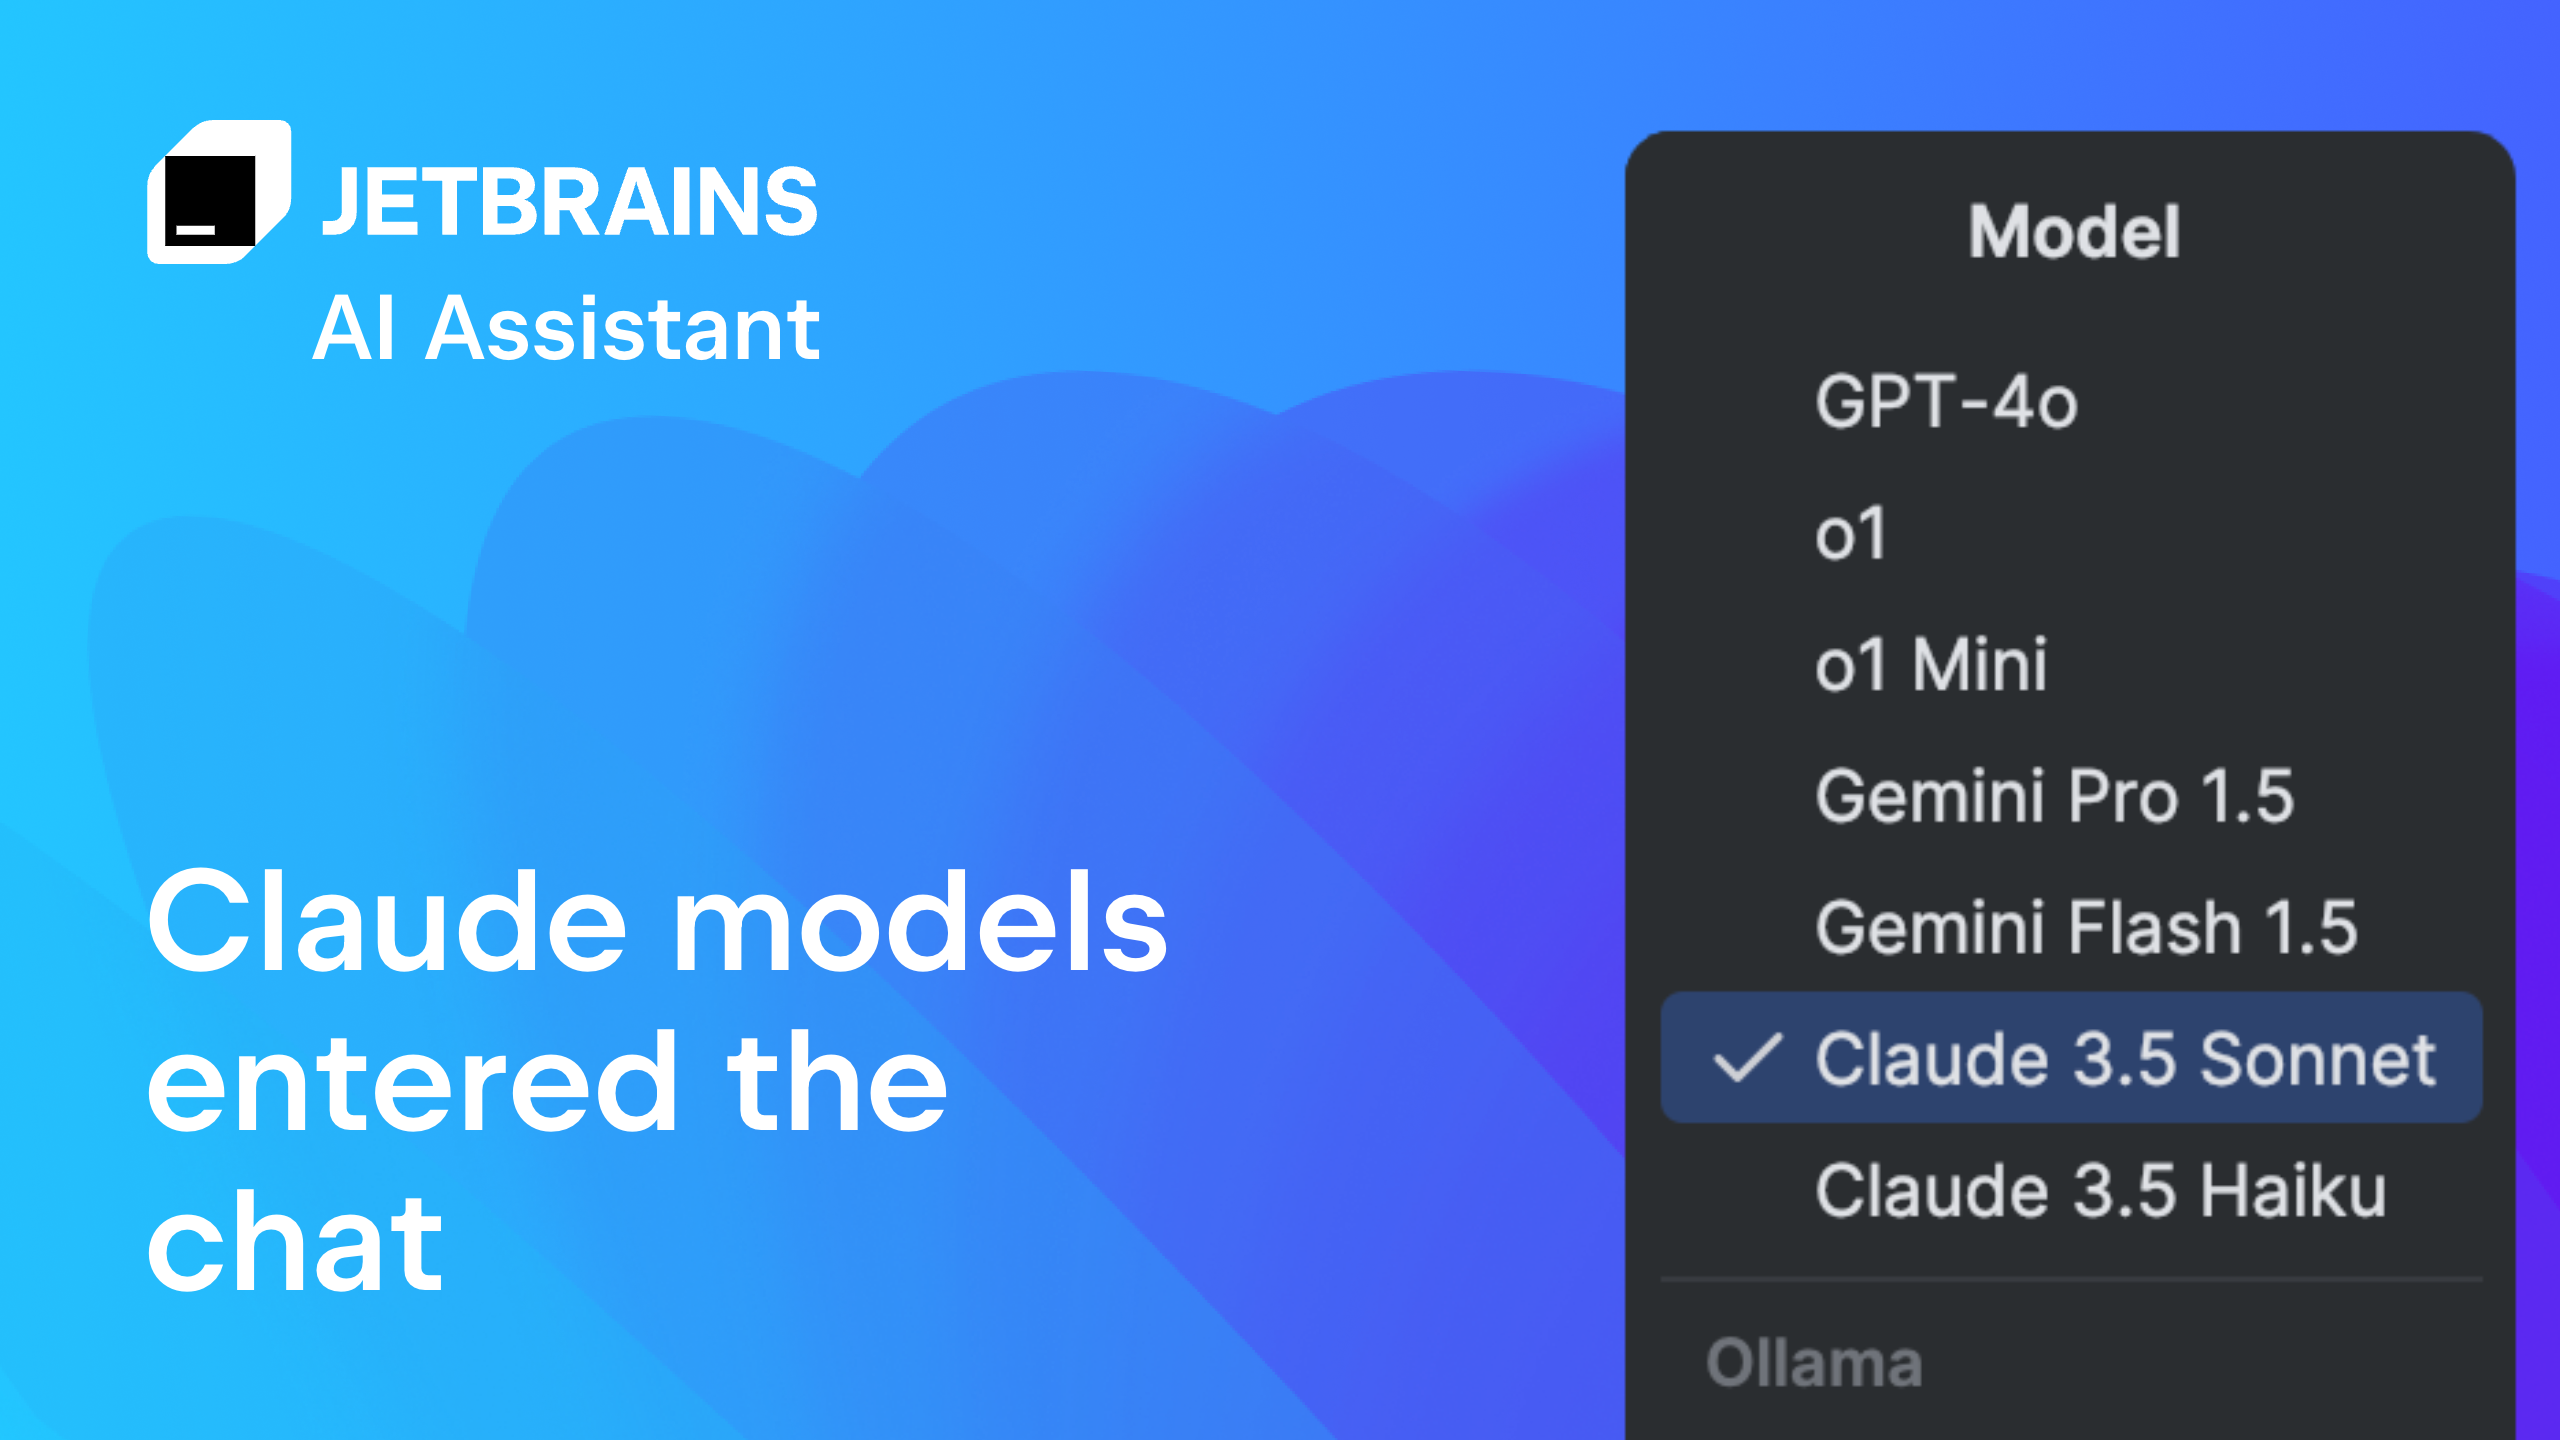
The JetBrains AI Assistant lives natively within IntelliJ, PyCharm, and other JetBrains IDEs, offering seamless access to AI capabilities without leaving your workflow. It provides inline code generation, test creation, and explanation features tailored to the specific language and framework you are using. This deep integration ensures that suggestions are highly relevant to your project structure, minimizing context switching and enhancing developer focus.
- Native IDE integration
- Inline code generation
- Test creation assistance
4. Tabnine for context-aware code completion
Tabnine distinguishes itself with advanced context-awareness, analyzing your entire codebase to provide highly accurate completions that respect your project’s unique patterns. It supports both cloud and on-premise deployments, making it ideal for teams with strict data privacy requirements. By learning from your specific coding style, Tabnine reduces typing effort and helps maintain consistency across large, complex software projects.

5. Amazon Q Developer for enterprise code analysis
Amazon Q Developer is designed for enterprise environments, offering robust code analysis and transformation capabilities across vast codebases. It helps identify technical debt, security vulnerabilities, and performance bottlenecks by leveraging AWS best practices. This tool is particularly valuable for large organizations looking to modernize legacy applications, providing actionable insights and automated refactoring suggestions to streamline the development lifecycle.

Pick the right fit
Top 5 AI-Powered Debugging Tools troubleshooting should start with a clear boundary: what is actually broken, and what still works normally. Check the display, network connection, paired devices, app access, and recent updates before assuming the whole system needs a reset. A small connection failure can make the main screen feel unreliable even when the core system is fine. Work from low-risk checks to deeper resets. Confirm power state, safe parking, account access, and signal first. Then restart the interface, wait for it to reload completely, and test the original symptom. Avoid changing multiple settings at once because that makes it harder to know which step actually fixed the problem. If the issue affects safety information, repeats after every restart, or appears with warning messages, treat the reset as a temporary diagnostic step rather than the final fix. Document the symptom and move to official support instead of stacking more DIY attempts.
-
Park and note the symptomPut the system in a safe idle state, then write down whether Top 5 AI-Powered Debugging Tools is frozen, blank, slow, disconnected, or only failing in one app.
-
Try the normal restart firstUse the standard screen or interface restart before changing settings, deleting profiles, or disconnecting accessories.
-
Retest one feature at a timeCheck touch response, audio, navigation, phone pairing, Wi-Fi, and app access separately so the failing path is clear.
-
Escalate repeated failuresContact official support when the screen stays black, warnings appear, or the same issue returns after a clean restart.
5 ai-powered debugging tools in 2026: automate bug tracking & fix code faster: what to check next
Helpful gear
Use these product recommendations as a starting point, then choose the size, material, and price point that fit how you actually use the gear.


As an Amazon Associate, we may earn from qualifying purchases.
No comments yet. Be the first to share your thoughts!