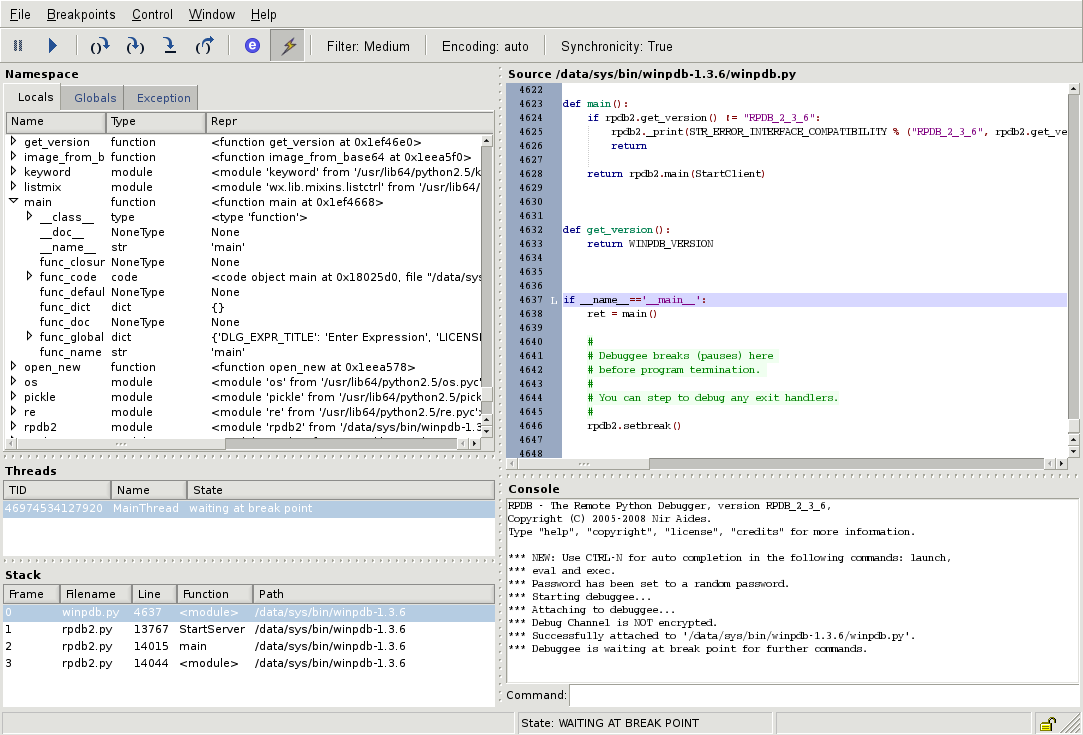
Debugging tools that actually find the bug
AI-powered debugging tools have shifted from simple syntax checkers to active pair programmers. They don't just highlight errors; they analyze code context, suggest fixes, and even explain why a bug occurred. For 2026, the best tools integrate directly into your IDE, reducing the time spent guessing and more time fixing.
We selected these five tools based on three practical criteria: integration depth with major IDEs (VS Code, JetBrains, Visual Studio), the accuracy of AI-generated suggestions, and real-world speed improvements. We prioritized tools that offer concrete remediation steps over vague error messages. This list focuses on active debugging assistants rather than passive linters.
5 AI-Powered Debugging Tools for 2026: Fix Bugs Faster with IDE Recommendations
These five AI-powered debugging tools integrate directly into your IDE to identify errors, suggest fixes, and explain root causes in real time. We evaluated each option for accuracy, speed, and compatibility with major development environments to help you choose the right solution for your workflow.
1. GitHub Copilot Chat for inline context-aware fixes
GitHub Copilot Chat integrates directly into VS Code and JetBrains IDEs to analyze your current file and repository context. It suggests precise code fixes for syntax errors and logical bugs without requiring you to leave your editor. This inline assistance reduces context-switching, allowing developers to resolve immediate issues while maintaining their workflow momentum and focus.

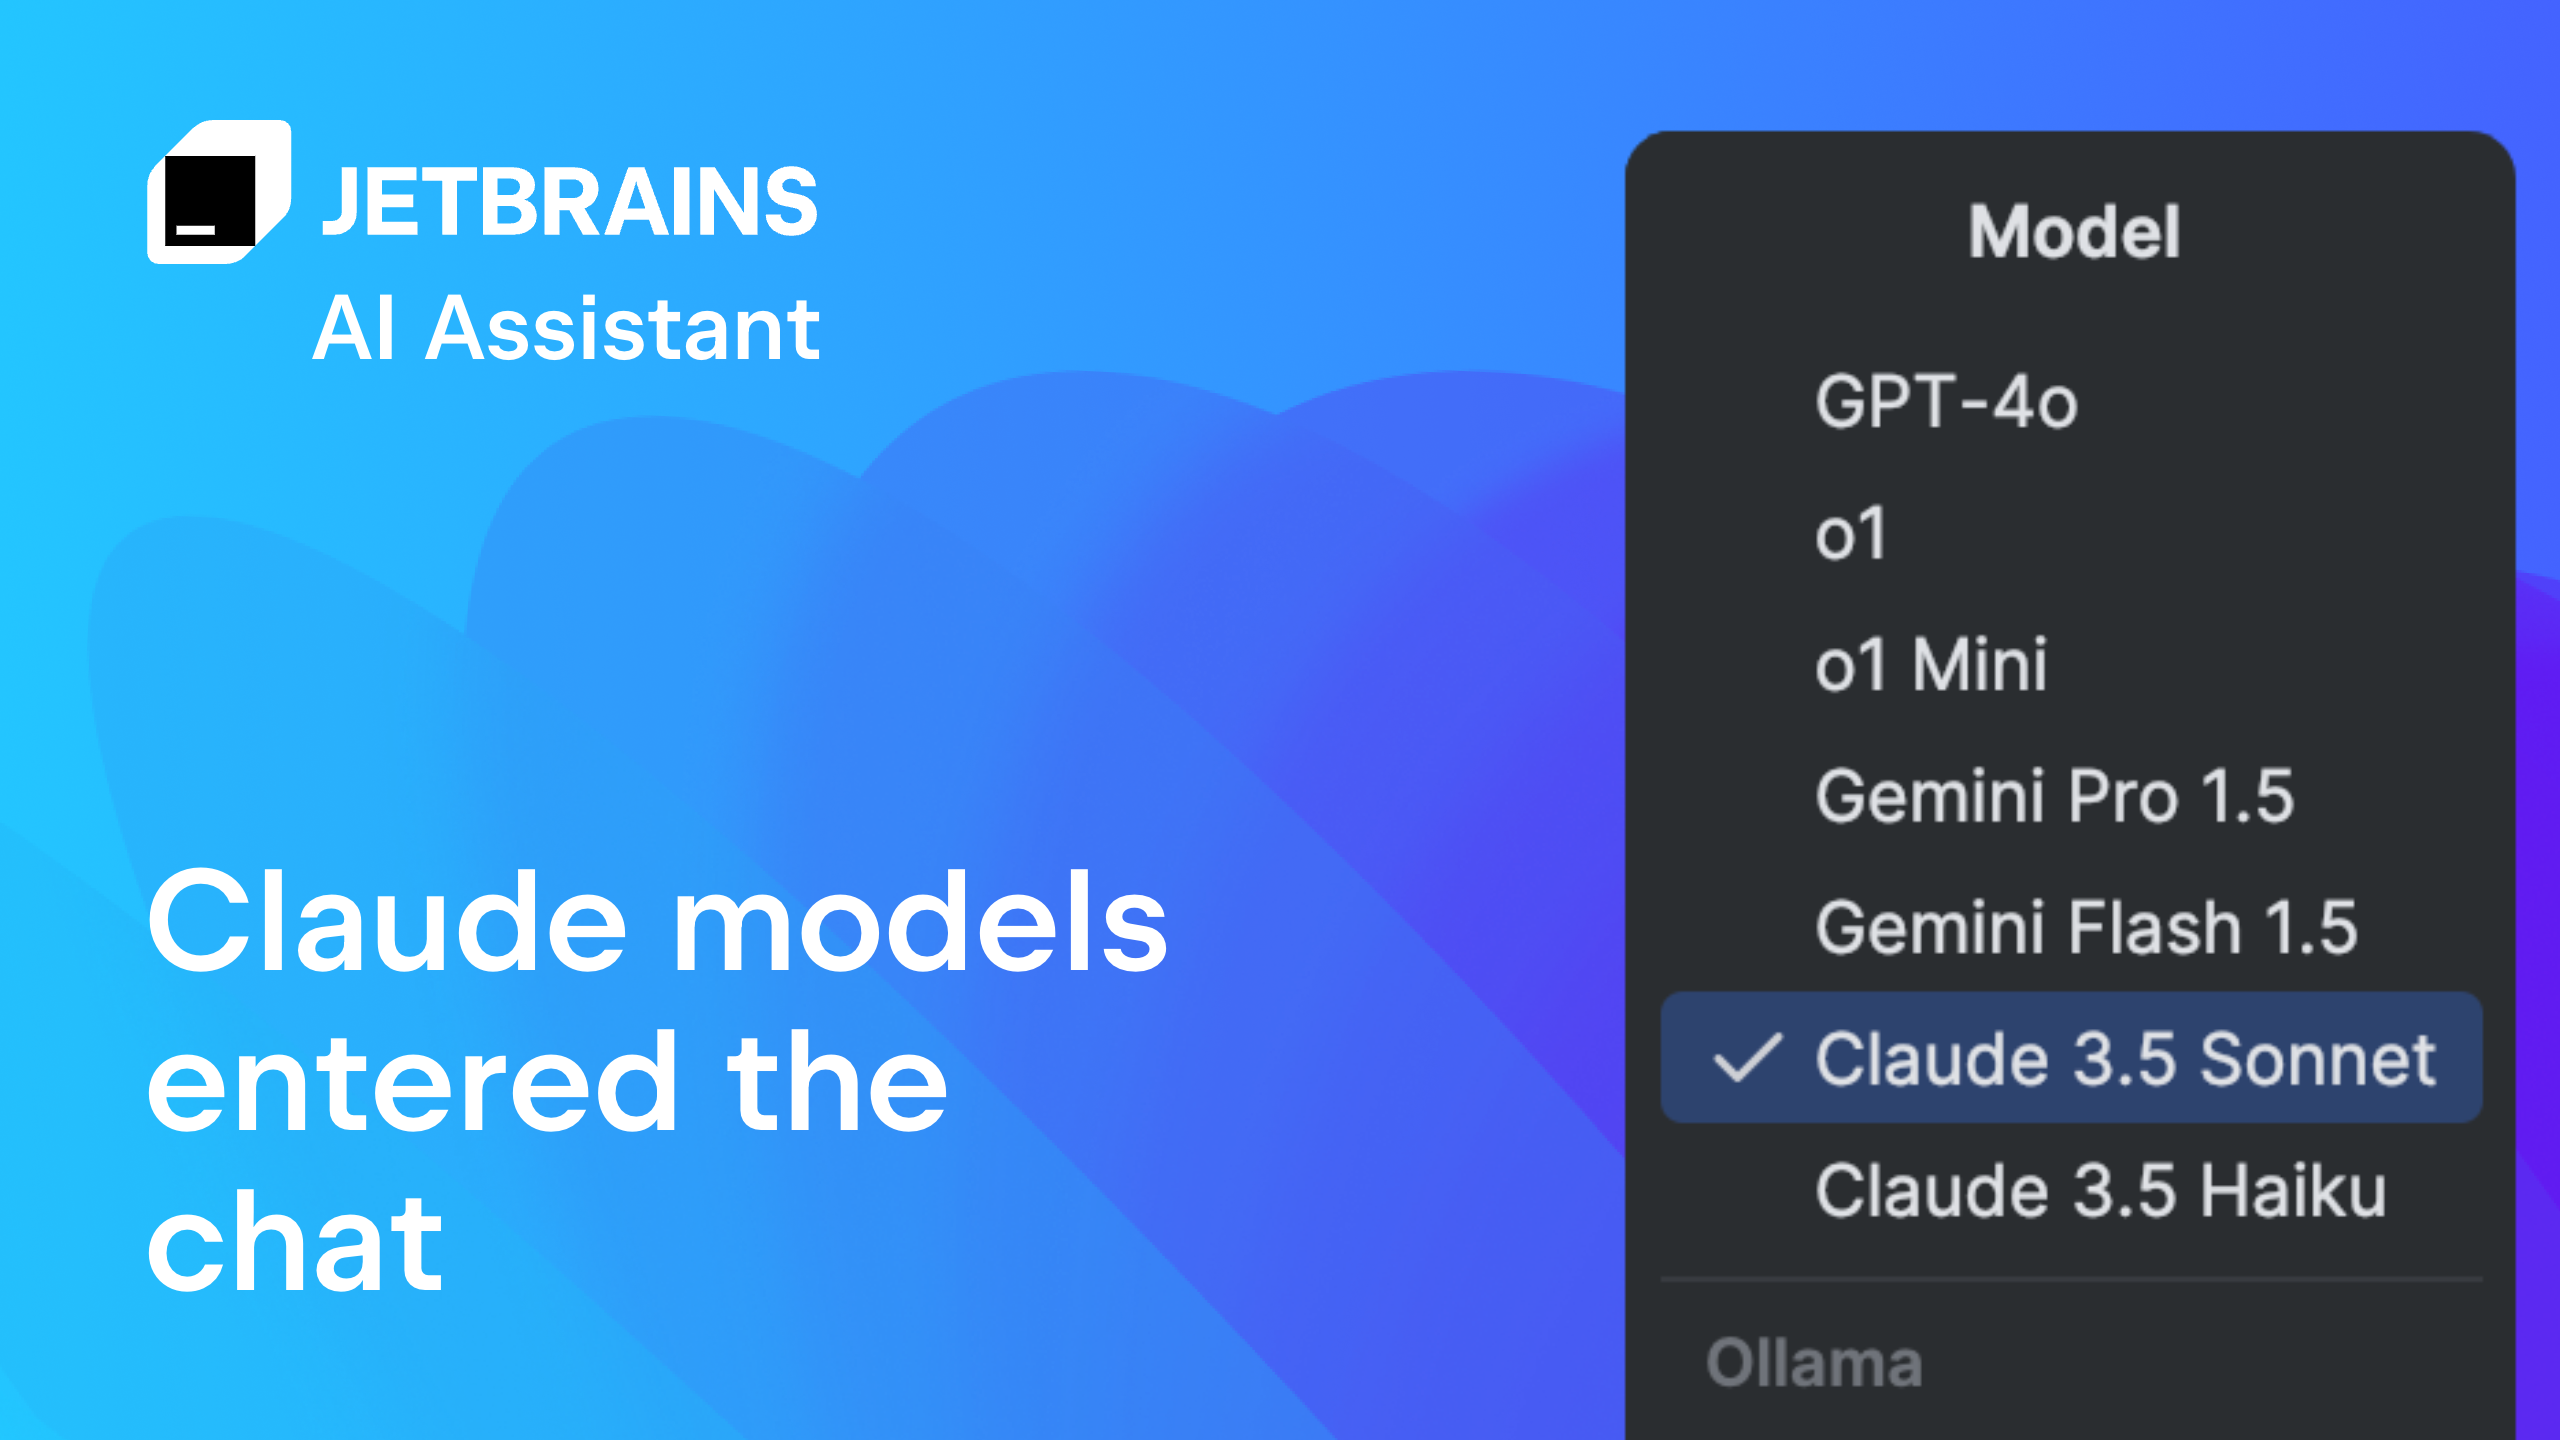
2. JetBrains AI Assistant for deep IDE integration
JetBrains AI Assistant offers native integration across the entire JetBrains ecosystem, including IntelliJ IDEA, PyCharm, and WebStorm. It understands complex project structures and can refactor entire modules or explain obscure error logs with high accuracy. This deep connection ensures that debugging suggestions are tailored to the specific language features and framework conventions used in your project.
3. Amazon CodeWhisperer for real-time security scanning
Amazon CodeWhisperer goes beyond syntax correction by performing real-time security scanning as you type. It identifies potential vulnerabilities like SQL injection or exposed credentials and suggests secure code alternatives immediately. This proactive approach helps developers write cleaner, safer code from the start, reducing the need for later security audits and patching cycles.

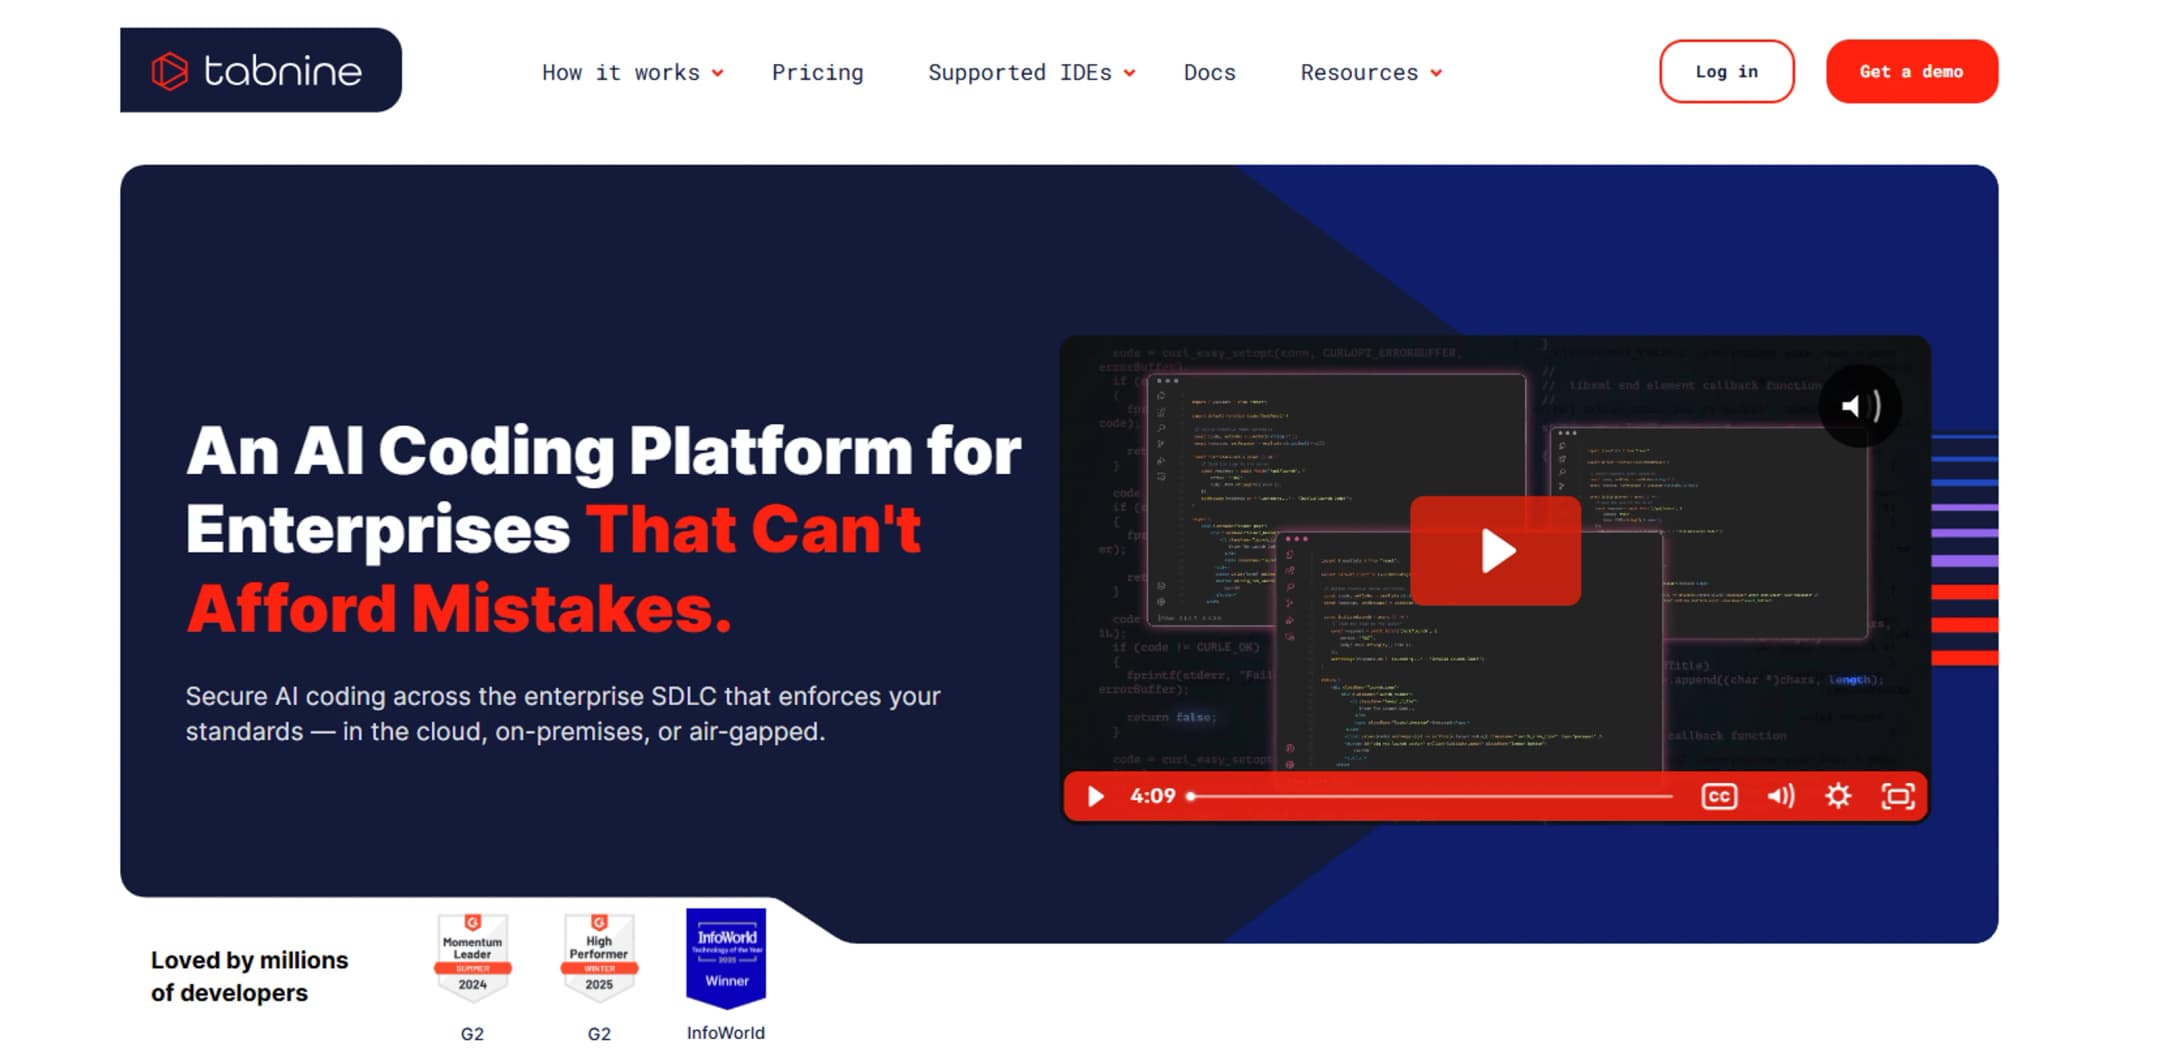
4. Tabnine for private, on-premise code completion
Tabnine prioritizes data privacy by offering on-premise deployment options for enterprise environments. It provides intelligent code completion that respects strict data governance policies, ensuring sensitive codebases never leave your secure infrastructure. This makes it an ideal choice for regulated industries where confidentiality is paramount, without sacrificing the speed of AI-assisted development.
5. Replit Agent for autonomous multi-file debugging
Replit Agent acts as an autonomous developer that can debug across multiple files simultaneously. It identifies dependencies between components and fixes broken links in complex projects without manual intervention. This capability is particularly useful for monorepos or large-scale applications where bugs often span across different modules, streamlining the resolution process significantly.
Pick the right AI debugging fit
Choosing an AI debugging tool isn't about finding the single "best" option, but finding the one that matches your current workflow. The right choice depends on your primary language, your IDE, and whether you need deep system-level access or quick code fixes. Think of this selection process as calibrating a lens: a wide-angle view captures more context but less detail, while a macro lens offers precision at the cost of breadth.
Check your primary language and framework
Not all AI debuggers support every language equally. Tools like JetBrains AI Assistant integrate deeply with Java, Python, and Kotlin ecosystems, offering context-aware fixes that understand framework-specific patterns. If you are working in C or C++, you might need a tool that interfaces with low-level debuggers like GDB or WinDbg. Verify that the tool supports your specific framework version before committing.
Evaluate IDE integration depth
An AI tool that lives in a separate browser tab adds friction to your debugging session. The best tools embed directly into your IDE, allowing you to run queries, view suggestions, and apply fixes without leaving your code editor. Check if the tool supports your preferred IDE (VS Code, IntelliJ, Visual Studio) and whether it can read your current file context and terminal output automatically.
Assess the level of access required
Some bugs require understanding memory layouts or kernel states, while others are simple logic errors in a web app. If you are debugging backend services or system crashes, you need tools with access to core dumps and system logs. For frontend or application-level logic, a tool that analyzes stack traces and variable states in real-time is usually sufficient. Match the tool's access level to the complexity of your typical bugs.
Compare pricing and usage limits
AI debugging often relies on cloud-based LLMs, which incur usage costs. Some tools offer unlimited usage for a flat subscription, while others charge per query or token. If you debug frequently, a flat-rate plan might be more cost-effective. Check if the free tier allows enough queries for initial testing to ensure the tool actually helps before you pay.
Verify team collaboration features
If you work in a team, the ability to share debug sessions or export AI-generated insights is valuable. Look for tools that allow you to share context snippets, save debugging configurations, or integrate with your project management tools. This ensures that the AI's assistance is a shared resource rather than a siloed activity.
| Criteria | High Priority | Medium Priority |
|---|---|---|
| Language Support | Must match your stack | Supports 5+ languages |
| IDE Integration | Native plugin for your IDE | Works via sidebar or web |
| Cost Model | Flat rate or generous free tier | Pay-per-query |
| Context Awareness | Reads full file/project context | Reads only current selection |



As an Amazon Associate, we may earn from qualifying purchases.
Frequently asked questions about AI debugging tools
What are the debugging tools? Debugging tools are software programs that help developers identify, test, and fix issues in code. They range from basic CLI interactive debuggers like gdb, windbg, and lldb to advanced IDE-integrated solutions such as Visual Studio Code and PyCharm. These tools provide a systematic approach to understanding application behavior by offering features like breakpoints, watchpoints, and real-time variable inspection.
What is the best debugging tool? The best debugging tool depends on your language and workflow. For general-purpose web development, Visual Studio Code is widely considered the top choice due to its extensive extension ecosystem. For C/C++ applications, tools like WinDbg or CLion offer deep system-level insights. AI-powered assistants are increasingly integrated into these environments to automate root cause analysis and suggest fixes, making them more efficient than traditional methods alone.
Can ChatGPT debug my code? Yes, ChatGPT can help debug code by analyzing error logs, explaining stack traces, and suggesting corrections. However, it should be used as a supplementary tool rather than a replacement for dedicated debuggers. Always verify AI-generated fixes in a safe environment, as LLMs may occasionally hallucinate syntax or miss edge cases in complex logic. Use it for quick explanations, but rely on IDE debuggers for precise, step-by-step execution.
Where are debugging tools for Windows? Microsoft provides the Debugging Tools for Windows as part of the Windows SDK and WDK. These include WinDbg, a powerful graphical debugger for analyzing crash dumps and kernel-level issues. You can download them directly from the Microsoft Learn documentation. For modern development, Visual Studio and Visual Studio Code also offer robust debugging capabilities for Windows applications, including C++, .NET, and Python.

No comments yet. Be the first to share your thoughts!