Why AI debugging matters now
For years, debugging meant a slow, manual cycle: set a breakpoint, stare at the stack trace, and hunt for the missing semicolon or logic error. It was a process of elimination that consumed hours and broke flow. In 2026, that era is ending. AI debugging tools have shifted the paradigm from manual identification to automated resolution, allowing developers to fix issues without leaving their workflow.
Modern AI debuggers don't just flag errors; they analyze the broader code context to suggest precise, executable fixes. This reduces the cognitive load on engineers, turning what used to be a frustrating hunt into a quick review process. The productivity gain is significant, allowing teams to focus on building features rather than untangling legacy bugs.
This shift is why we are focusing on specific, high-utility tools rather than abstract categories. The best solutions integrate directly into your IDE, understanding the project structure and dependencies to provide context-aware fixes. This section explores the top five AI debugging tools that are leading this change, offering automated fixes that actually work.
5 AI Debugging Tools in 2026: Automated Fixes and IDE Recommendations
By 2026, AI debugging has shifted from passive log analysis to proactive, automated code correction. This roundup evaluates five specific tools—Cursor, GitHub Copilot, Codeium, Amazon CodeWhisperer, and JetBrains AI Assistant—focusing on their native IDE integration and fix accuracy.
1. Amazon CodeWhisperer IDE Integration
CodeWhisperer embeds directly into VS Code and JetBrains environments, offering real-time security scans alongside code suggestions. It identifies vulnerable patterns and suggests secure replacements, making it a robust choice for teams prioritizing compliance. The tool operates with minimal latency, ensuring developers maintain their workflow rhythm while receiving automated security fixes.
2. GitHub Copilot Chat Debugging
GitHub Copilot Chat allows developers to paste error logs directly into the chat interface for instant analysis. It contextualizes stack traces within the specific file structure, offering precise explanations of why a test failed or a runtime exception occurred. This conversational approach turns debugging from a guessing game into a targeted investigation, saving hours of manual log review.

3. JetBrains AI Assistant Fixes
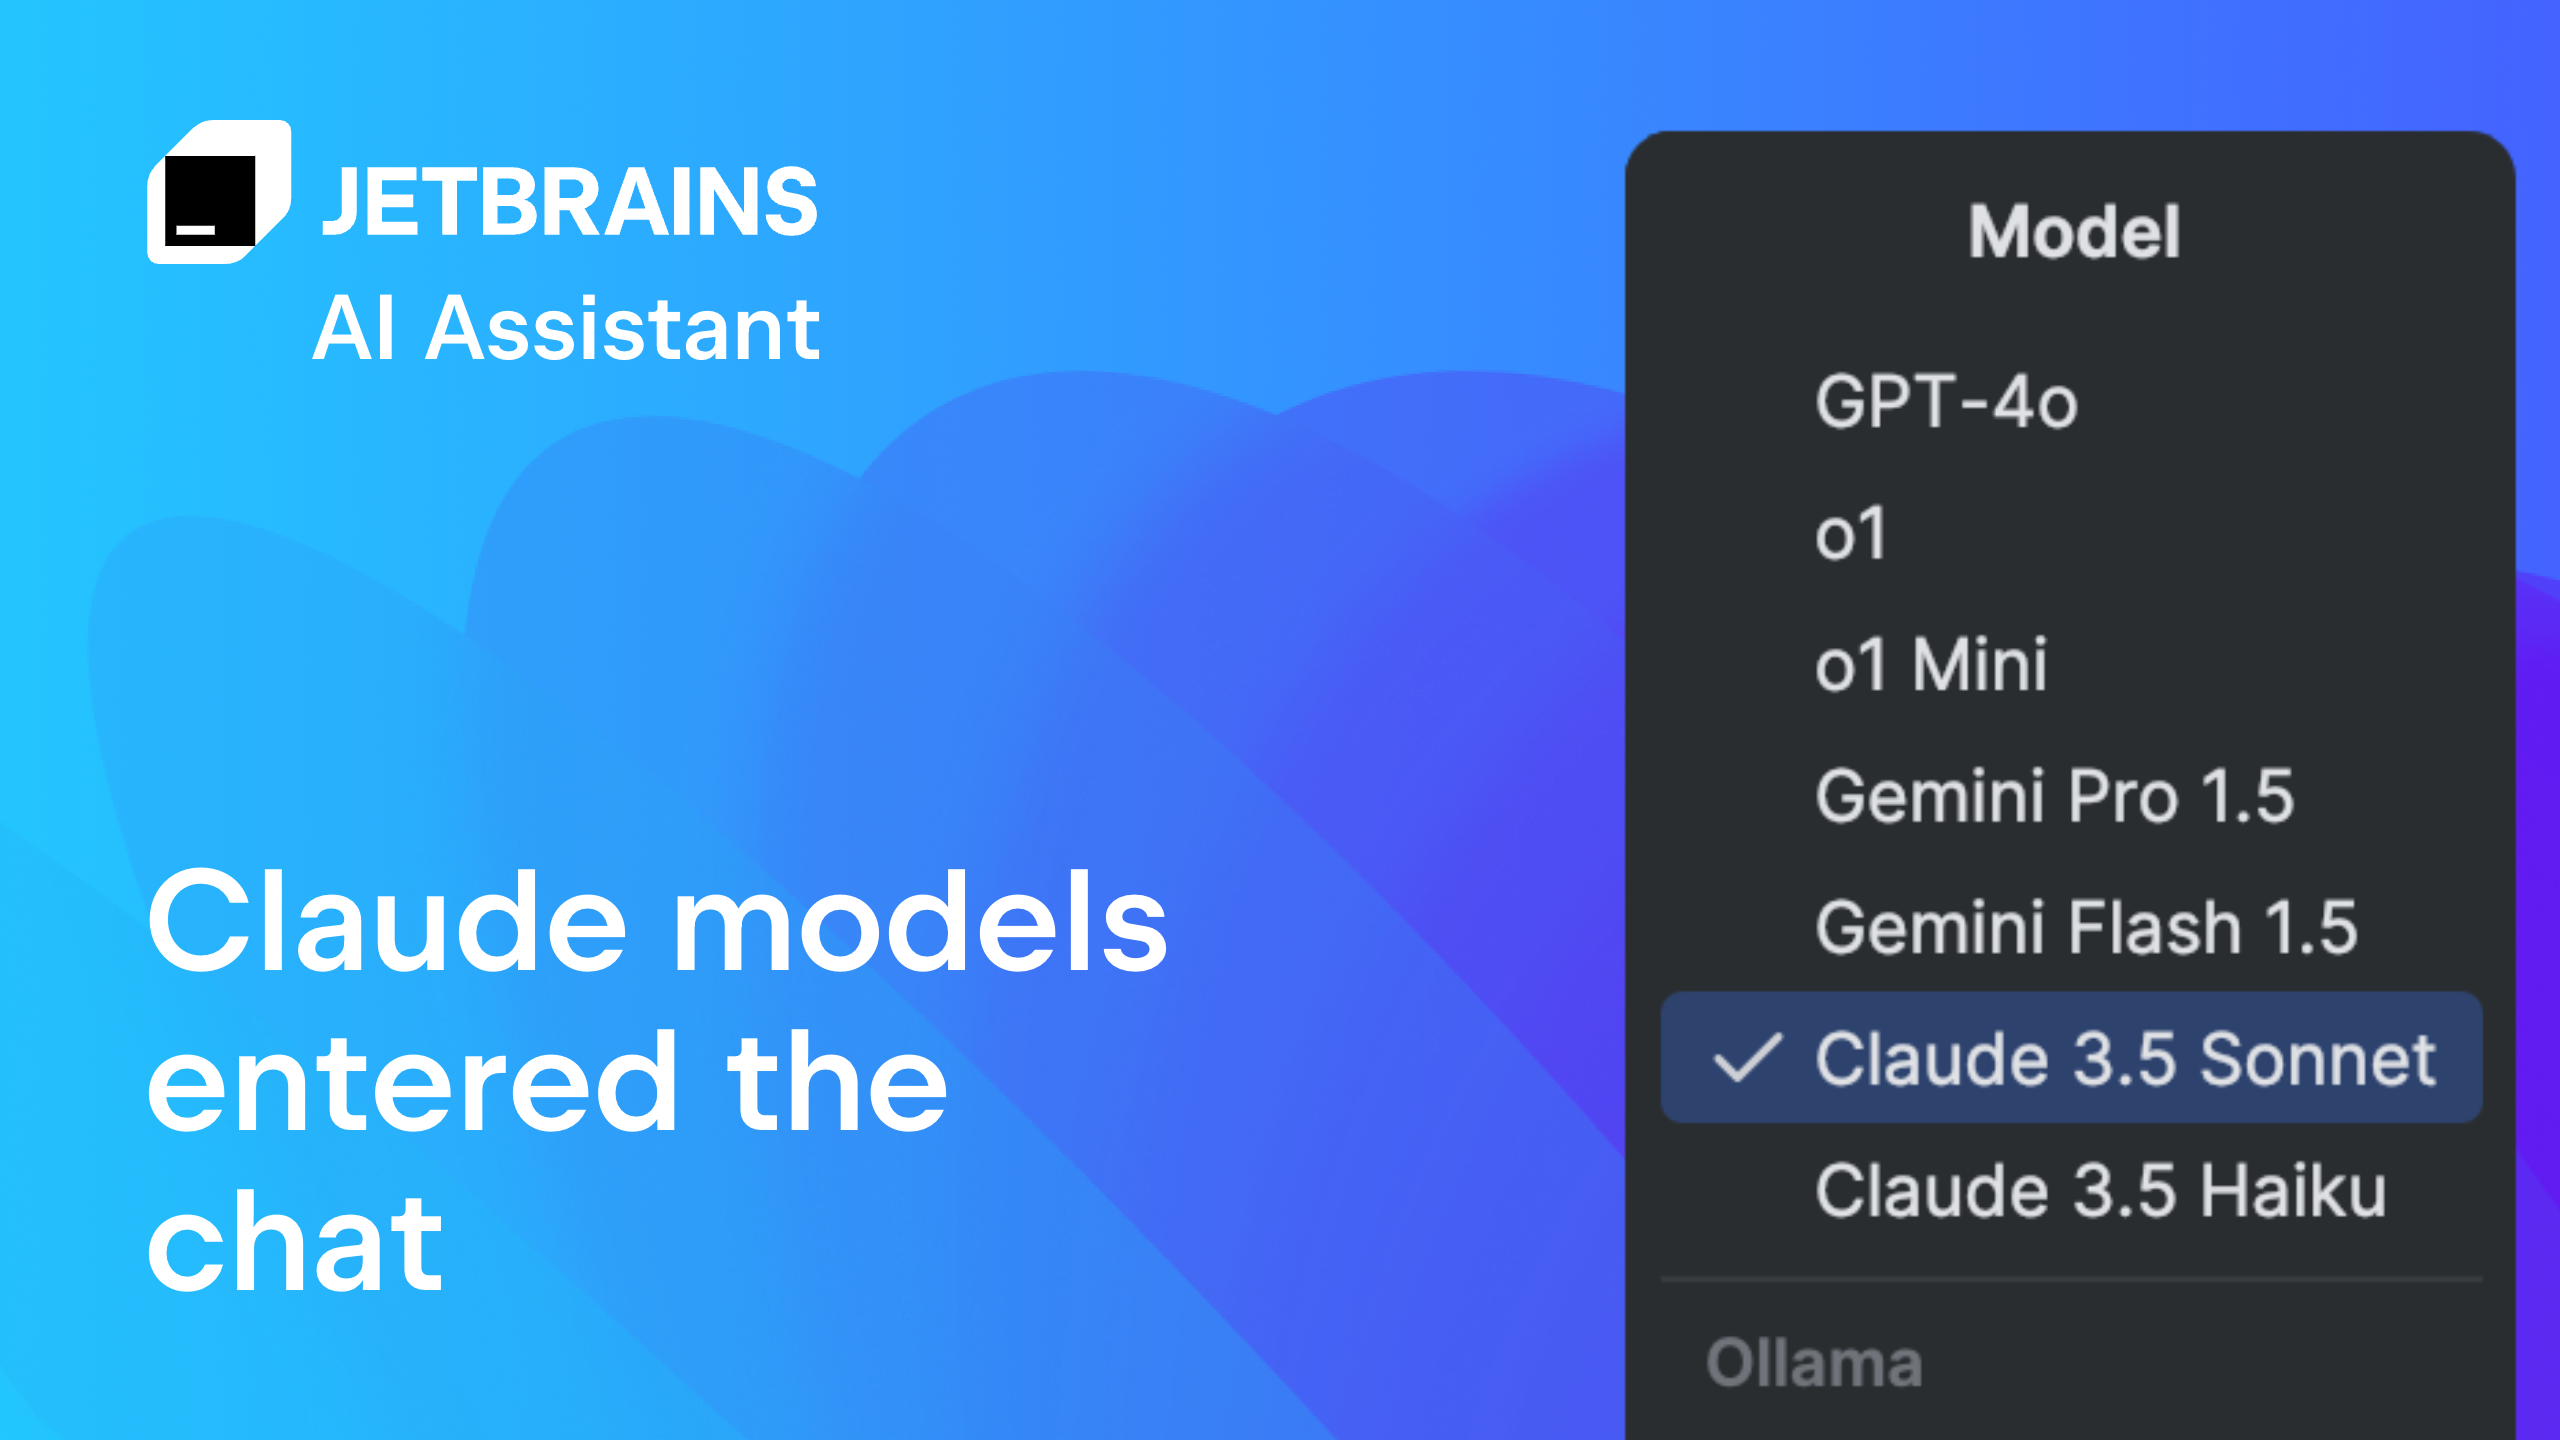
The JetBrains AI Assistant integrates natively with IntelliJ, PyCharm, and other IDEs, offering inline suggestions for fixing syntax errors and logic bugs. It understands the broader project context, allowing it to propose fixes that respect existing architectural patterns. Developers can apply one-click corrections for common pitfalls, streamlining the refactoring process without leaving their primary development environment.
4. Tabnine Code Completion Debug
Tabnine focuses on private, on-premise code completion that adapts to your team's specific coding standards. When debugging, it suggests completions based on your internal codebase, reducing hallucinations common with public models. This localized approach ensures that suggested fixes align with proprietary architectures, providing a secure and accurate debugging experience for enterprise environments.

5. Replit AI Agent Debugging
Replit’s AI Agent operates autonomously within the browser-based IDE, capable of running tests and fixing bugs without manual intervention. It can reproduce errors, identify the root cause, and apply patches across multiple files simultaneously. This agent-like behavior is ideal for rapid prototyping, allowing developers to iterate quickly by delegating repetitive debugging tasks to the AI.

How automated fixes work
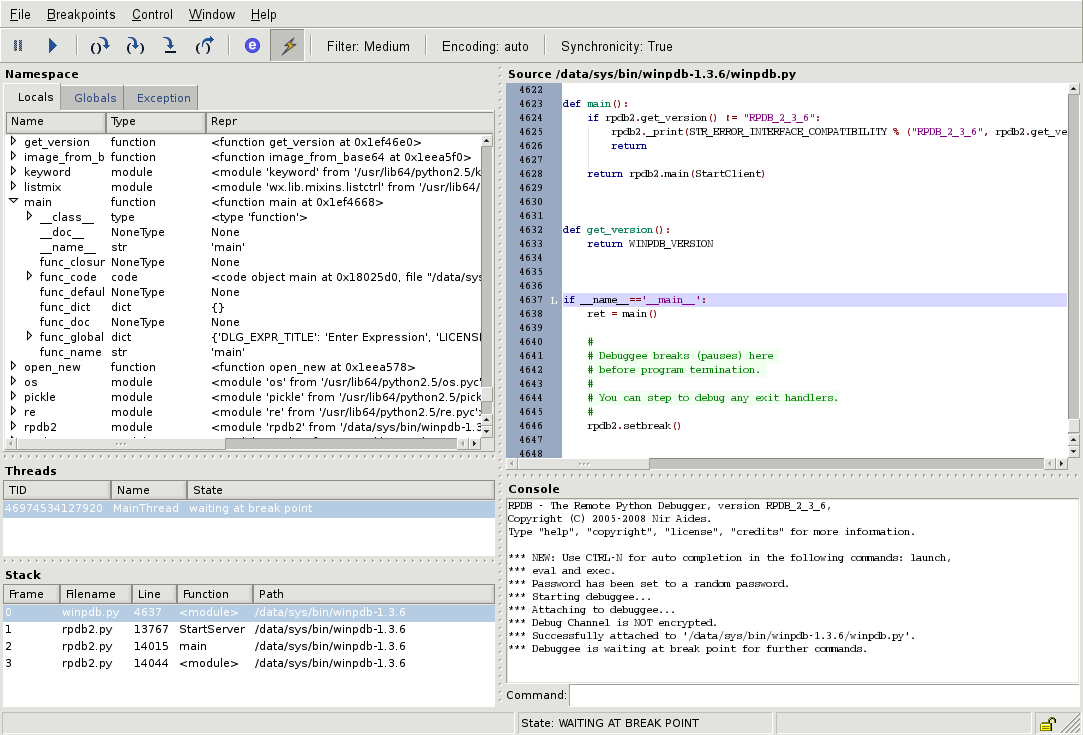
AI debugging tools operate as a hybrid between a static analyzer and a large language model. When you encounter a runtime error or a linter warning, the tool doesn't just scan for syntax; it ingests the full context of your codebase. It maps the failing function to its dependencies, variable states, and historical commits, creating a semantic map of the issue.
The core mechanism follows a three-step pipeline: identification, generation, and verification. First, the AI parses the stack trace or error log to pinpoint the root cause. Unlike traditional debuggers that stop execution, AI tools can often infer the missing logic or the incorrect condition. Next, it generates a patch. This isn't a random guess; the model retrieves similar patterns from its training data or your own codebase to propose a fix that respects your existing architecture.
Finally, the tool runs a verification step. It simulates the execution of the proposed fix or runs unit tests to ensure the change resolves the error without introducing regressions. Tools like GitHub Copilot Workspace and Amazon CodeWhisperer rely on this loop. They don't just suggest code; they validate that the suggested block integrates cleanly with your current environment, turning a confusing error log into a single-click resolution.
IDE recommendations for 2026
The best debugging tools are only as effective as the environment they live in. In 2026, the line between editor and debugger has blurred, with AI agents embedded directly into the coding interface. Choosing the right IDE is no longer just about syntax highlighting; it is about selecting a platform that natively supports the AI debugging tools you rely on.
Visual Studio Code
VSCode remains the default choice for most developers because its extension ecosystem is unmatched. Extensions like GitHub Copilot and Amazon CodeWhisperer integrate seamlessly, offering inline fixes and real-time error detection. Its lightweight nature allows you to run multiple debugging sessions without slowing down your machine, making it ideal for web development and polyglot projects.
JetBrains IntelliJ IDEA
For Java, Kotlin, and enterprise-level applications, IntelliJ IDEA offers superior static analysis. Its AI assistant, JetBrain's AI, understands the full project context, not just the open file. This allows it to suggest fixes that respect existing architecture and design patterns, reducing the risk of introducing new bugs while solving immediate errors.
VS Code vs. IntelliJ IDEA
The choice often comes down to language and project size. VSCode is faster and more flexible for scripting and web technologies, while IntelliJ provides deeper, more accurate refactoring and debugging for large, complex codebases.
| Feature | VSCode | IntelliJ IDEA |
|---|---|---|
| Startup Time | Fast | Slower |
| AI Integration | Via Extensions | Native |
| Best For | Web, Python, JS | Java, Enterprise |
Cursor
Cursor is a new contender that forks VSCode but rebuilds the core for AI-first workflows. It allows you to highlight a block of code and ask the AI to debug it, instantly applying the fix. For teams already using VSCode, migrating to Cursor is a low-friction way to access advanced AI debugging without learning a new interface.


As an Amazon Associate, we may earn from qualifying purchases.

No comments yet. Be the first to share your thoughts!