How We Chose the Top 5 AI Debugging Tools
Finding the right AI-powered debugging tool requires looking beyond marketing claims. We evaluated five leading options based on their ability to actually fix code, not just highlight errors. The selection process focused on three practical criteria: integration depth with popular IDEs, accuracy of auto-generated patches, and support for multiple programming languages.
We prioritized tools that reduce context switching. A debugger is only useful if it integrates smoothly into your existing workflow, whether you are using VS Code, JetBrains, or Vim. We also tested each tool against common error patterns, such as null pointer exceptions and syntax mismatches, to ensure the AI suggestions were reliable and safe to apply.
The final list includes a mix of specialized plugins and comprehensive IDE features. Each entry below explains why it made the cut, what it does best, and where it falls short. This approach helps you choose a tool that fits your specific stack rather than adopting a one-size-fits-all solution.
5 AI-Powered Debugging Tools for 2026: Automate Code Fixes & Streamline Development
Manual debugging slows down 2026 development cycles, but these five AI-powered tools automate code fixes and streamline workflows. We evaluated each option for accuracy, integration ease, and real-world tradeoffs to help you choose the right solution for your stack.
Pick the right fit
Choosing an AI debugging tool requires matching the software to your specific pain points. Not every tool solves the same problems, and some are better suited for deep system analysis while others excel at quick code fixes. Use this framework to decide which option aligns with your workflow.
Start by verifying primary language compatibility. While many tools support Python and JavaScript, coverage for Rust, Go, or C++ varies. If you work in multiple languages, prioritize a tool with broad ecosystem support to avoid switching contexts.
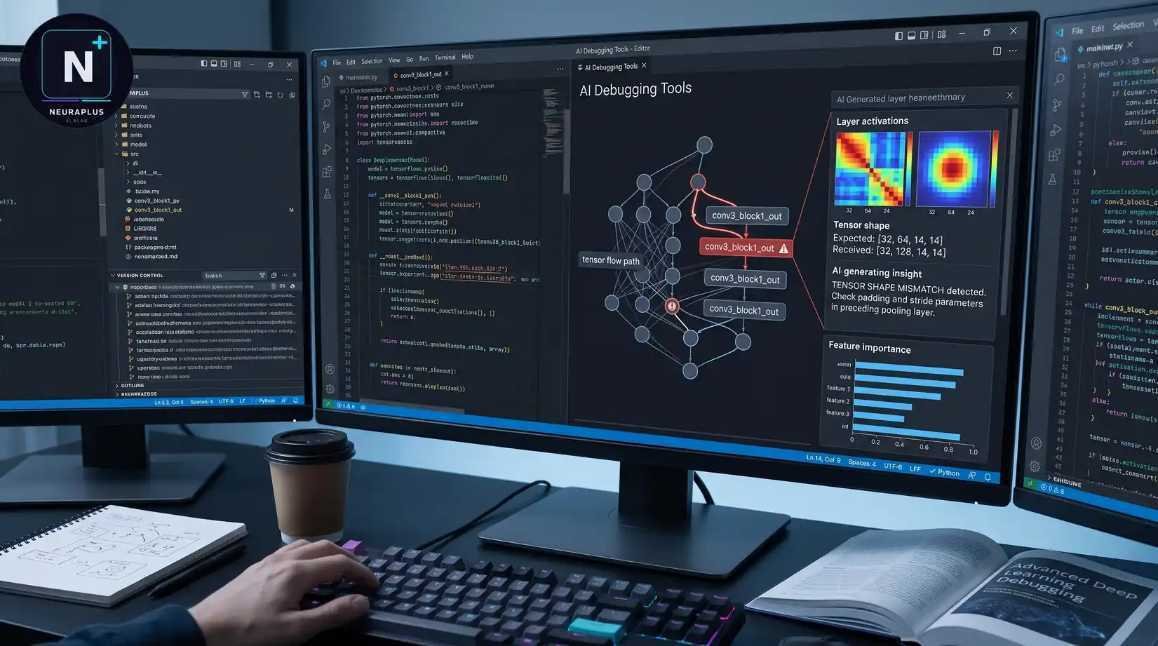
The best tools live inside your IDE rather than in a separate web portal. Look for native extensions for VS Code, IntelliJ, or Visual Studio. Seamless integration reduces friction, allowing you to debug without leaving your primary coding environment.
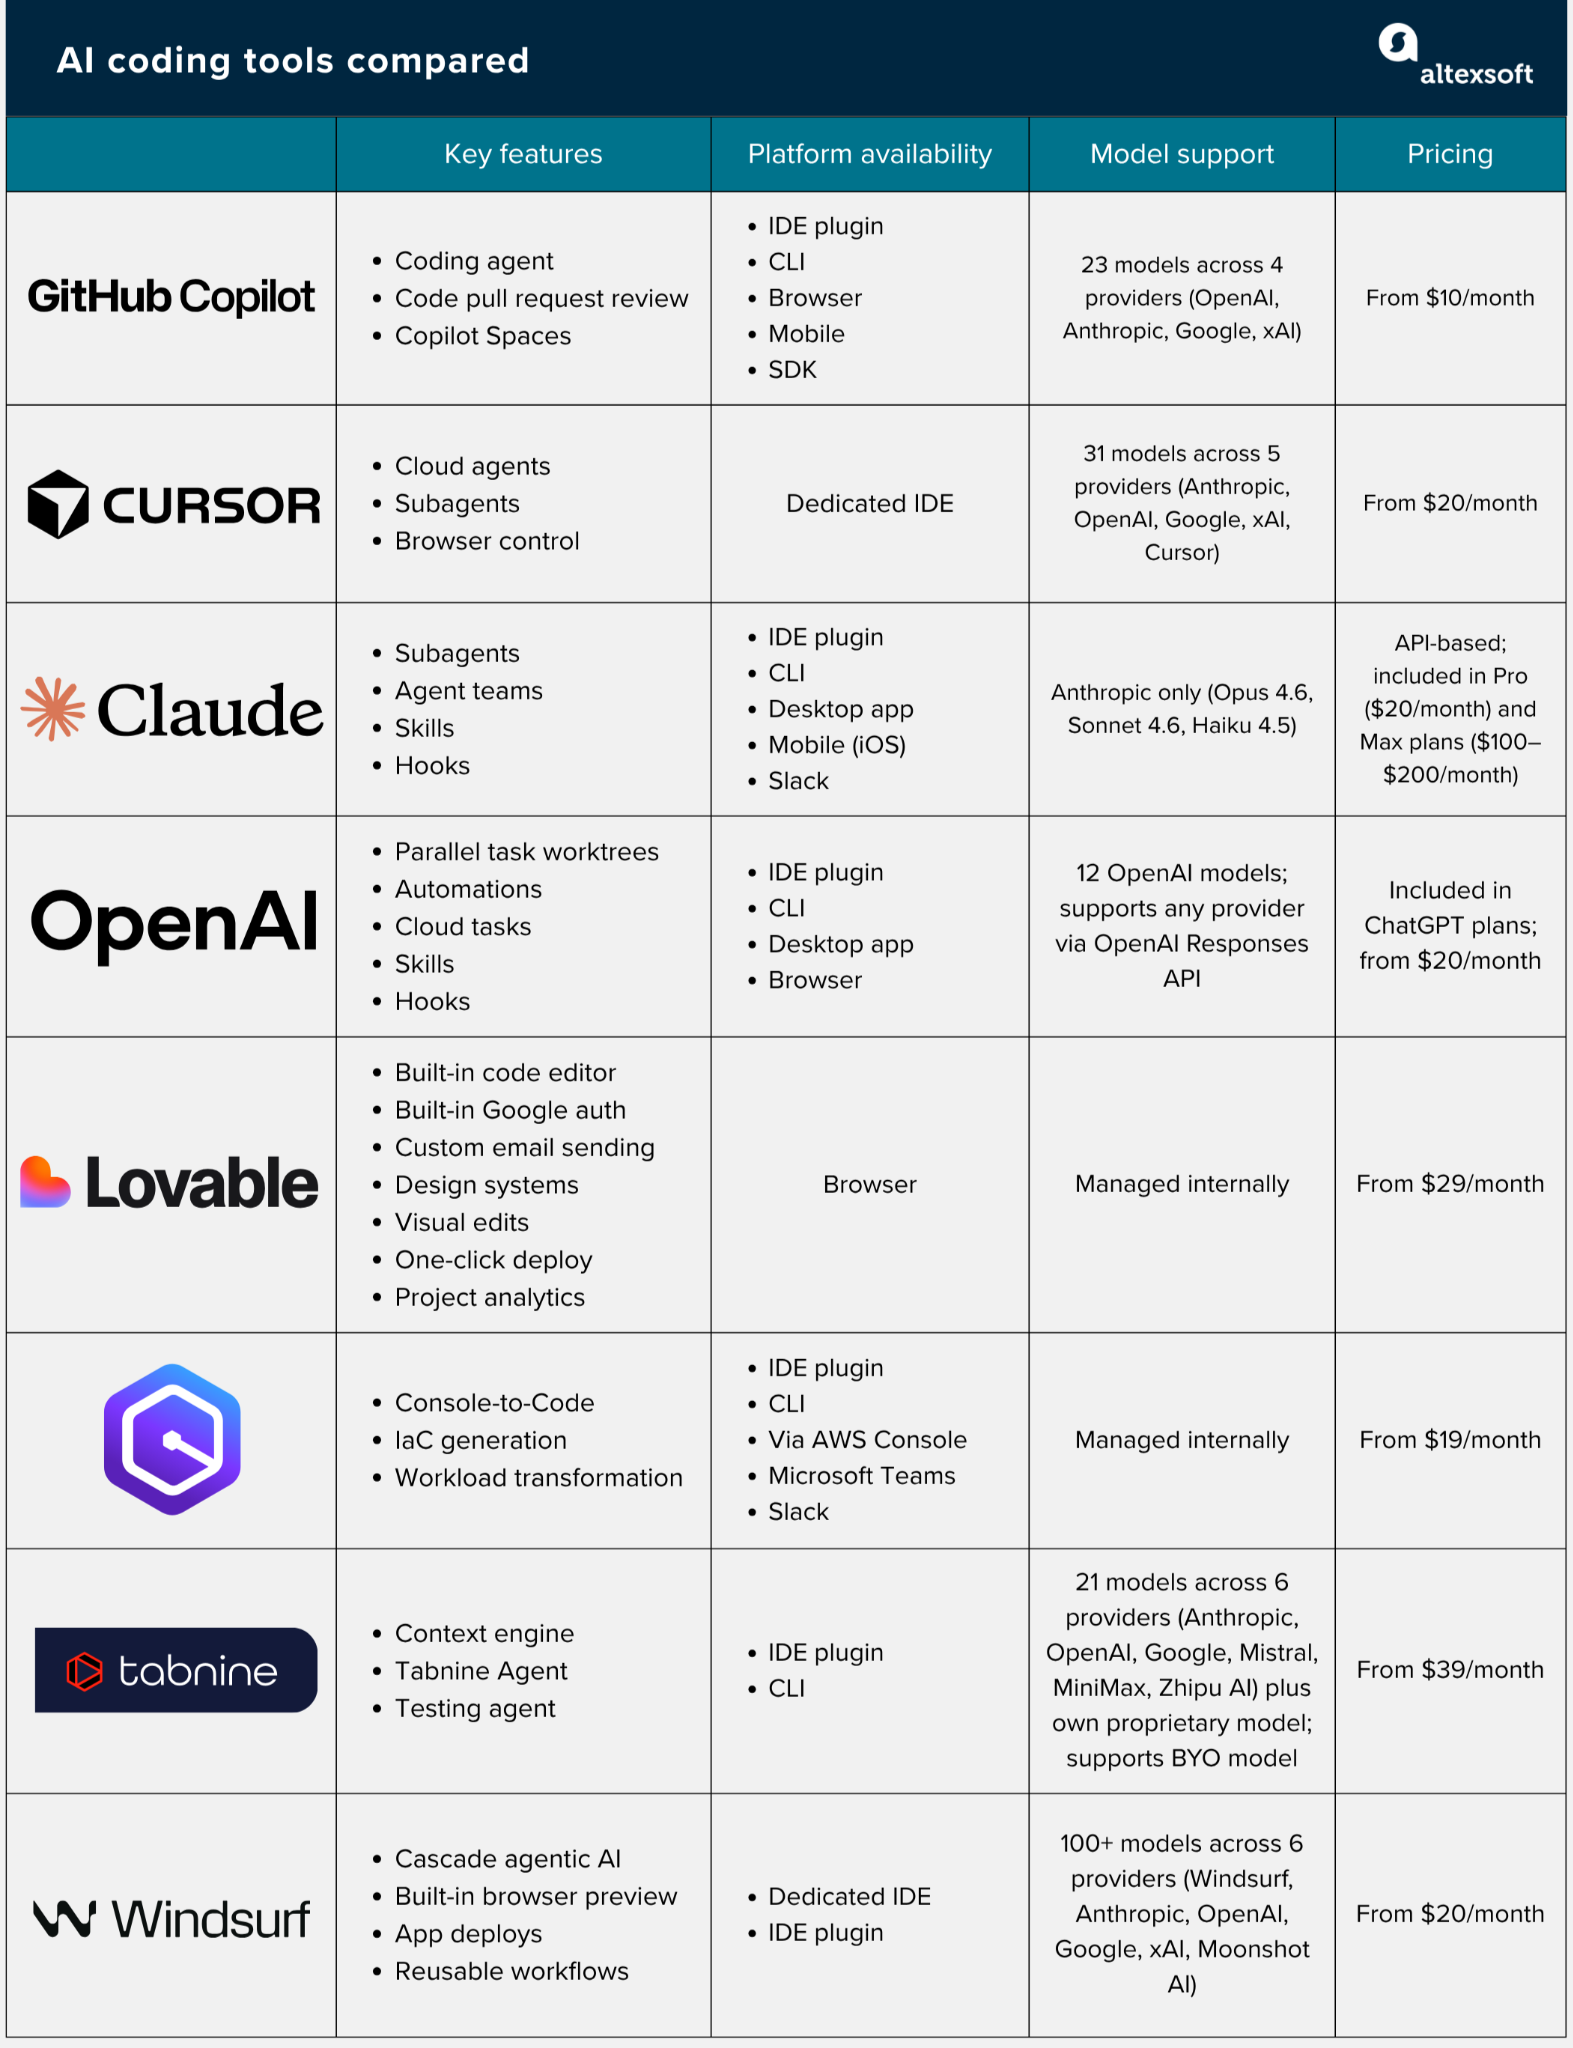
Test the tool on your most common bug patterns. Does it provide actionable code patches, or just vague explanations? High-quality AI debugging tools should generate correct, copy-pasteable fixes that respect your existing code style and architecture.
AI tools often require API keys or subscriptions. For enterprise teams, verify data privacy policies to ensure your code isn't used to train public models. Free tiers are great for solo developers, but paid plans usually offer higher rate limits and priority support.
Modern development is rarely solitary. Check if the tool supports shared debugging sessions or team-wide error tracking. Features like live session sharing allow junior developers to learn from senior engineers' debugging processes in real time, accelerating team growth.
| Feature | IDE Integration | Cost |
|---|---|---|
| Deep Analysis | Native | Paid |
| Quick Fixes | Browser-based | Free/Paid |
| Log Parsing | CLI/Plugin | Free |


As an Amazon Associate, we may earn from qualifying purchases.

No comments yet. Be the first to share your thoughts!