Pick the right debugging tools
Before writing code or opening an IDE, you need a stack that matches your language and environment. AI-powered debuggers are powerful, but they rely on the same underlying engine as traditional tools: breakpoints, stack traces, and variable inspection. If your environment isn’t set up correctly, the AI will just be guessing in the dark.

Check language support
Not all AI debuggers support every framework. Ensure your primary language (Python, JavaScript, C++, etc.) is fully supported. Look for tools that offer deep integration with your specific IDE (VS Code, IntelliJ, PyCharm) rather than generic web-based assistants. Native integration means the AI can read your local variables and file structure in real-time.
Verify environment compatibility
AI tools often need access to your terminal or container logs. Check if your debugging tool supports your deployment target—local machine, Docker container, or cloud server. If you’re debugging a distributed system, you need a tool that can trace requests across services, not just a single function.
Assess data privacy
Debugging tools often send code snippets to LLMs for analysis. If you’re working with proprietary code or sensitive user data, check the provider’s data retention policy. Prefer tools that offer local processing or clear data deletion options to avoid leaking intellectual property.


As an Amazon Associate, we may earn from qualifying purchases.
Run debugging tools safely
Before you start tracing a complex bug, you need to ensure your debugging environment is isolated and stable. Running debuggers on production code or without proper sandboxing can corrupt data, trigger race conditions, or crash the host system. Treat your debugger like a surgical instrument: precise, controlled, and used in a sterile field.
1. Create an isolated environment
Never run heavy debugging sessions directly on your main development machine or production servers. Use a dedicated virtual machine, Docker container, or a separate physical machine. This prevents the debugger from interfering with other processes and ensures that if the target application crashes, it doesn't take down your entire system.
For containerized applications, use Docker with increased memory limits and CPU quotas to handle the overhead of instrumentation. If you are debugging a kernel-level issue, use a dedicated VM with hardware virtualization enabled. This isolation is your first line of defense against accidental data loss or system instability.
2. Configure resource limits
Debuggers consume significantly more resources than standard applications. Memory dumps, trace logs, and symbolic information can quickly fill up disk space and RAM. Set explicit resource limits for your debugging session to prevent the debugger from consuming all available system resources.
In Linux, use ulimit to restrict memory and file descriptors. In Windows, use Task Manager or PowerShell to set process priority and memory limits. Monitor these resources during your session. If you see the debugger slowing down or the system becoming unresponsive, reduce the verbosity of your logs or increase the isolation boundaries.
3. Validate tool compatibility
Ensure that your debugging tools are compatible with your operating system, architecture, and target application. Mismatched versions of debuggers, symbol servers, and runtime libraries can lead to incorrect trace data or failed connections. Always download tools from official sources, such as Microsoft Learn for Windows Debugging Tools or official language-specific debugger repositories.
Check the version of your debugger against the version of the runtime you are debugging. For example, if you are debugging a .NET Core application, ensure your debugger supports the specific .NET version. Mismatched symbols can lead to confusing stack traces and wasted time.
4. Enable safe logging and tracing
Configure your debugger to write logs to a secure, isolated location. Avoid logging sensitive data such as passwords, tokens, or personally identifiable information (PII). Use structured logging formats like JSON or XML to make it easier to parse and analyze logs later.
Set log rotation policies to prevent disk space exhaustion. For example, configure your debugger to rotate logs every 100MB or after 24 hours. This ensures that you always have recent logs available without filling up your disk. Use encryption for logs if they contain sensitive information.
5. Test with a non-critical bug
Before tackling your complex bug, run a test debug session with a known, non-critical issue. This helps you verify that your environment is set up correctly and that your debugger is functioning as expected. It also allows you to practice your debugging workflow without the pressure of a live issue.
Choose a simple bug, such as a null pointer exception or a memory leak in a test environment. Trace through the code, set breakpoints, and inspect variables. This practice builds muscle memory and helps you identify any configuration issues in your debugging setup.

Set up a dedicated VM or container. Ensure it has sufficient resources and is disconnected from production networks. Verify that your host machine is stable and ready for debugging sessions.

Download the official debugger for your target platform. Install necessary symbol packages. Configure resource limits and logging paths to prevent system overload and data leakage.

Test the debugger connection with a simple application. Ensure symbols are loading correctly. Check that the debugger can attach to the target process without errors.
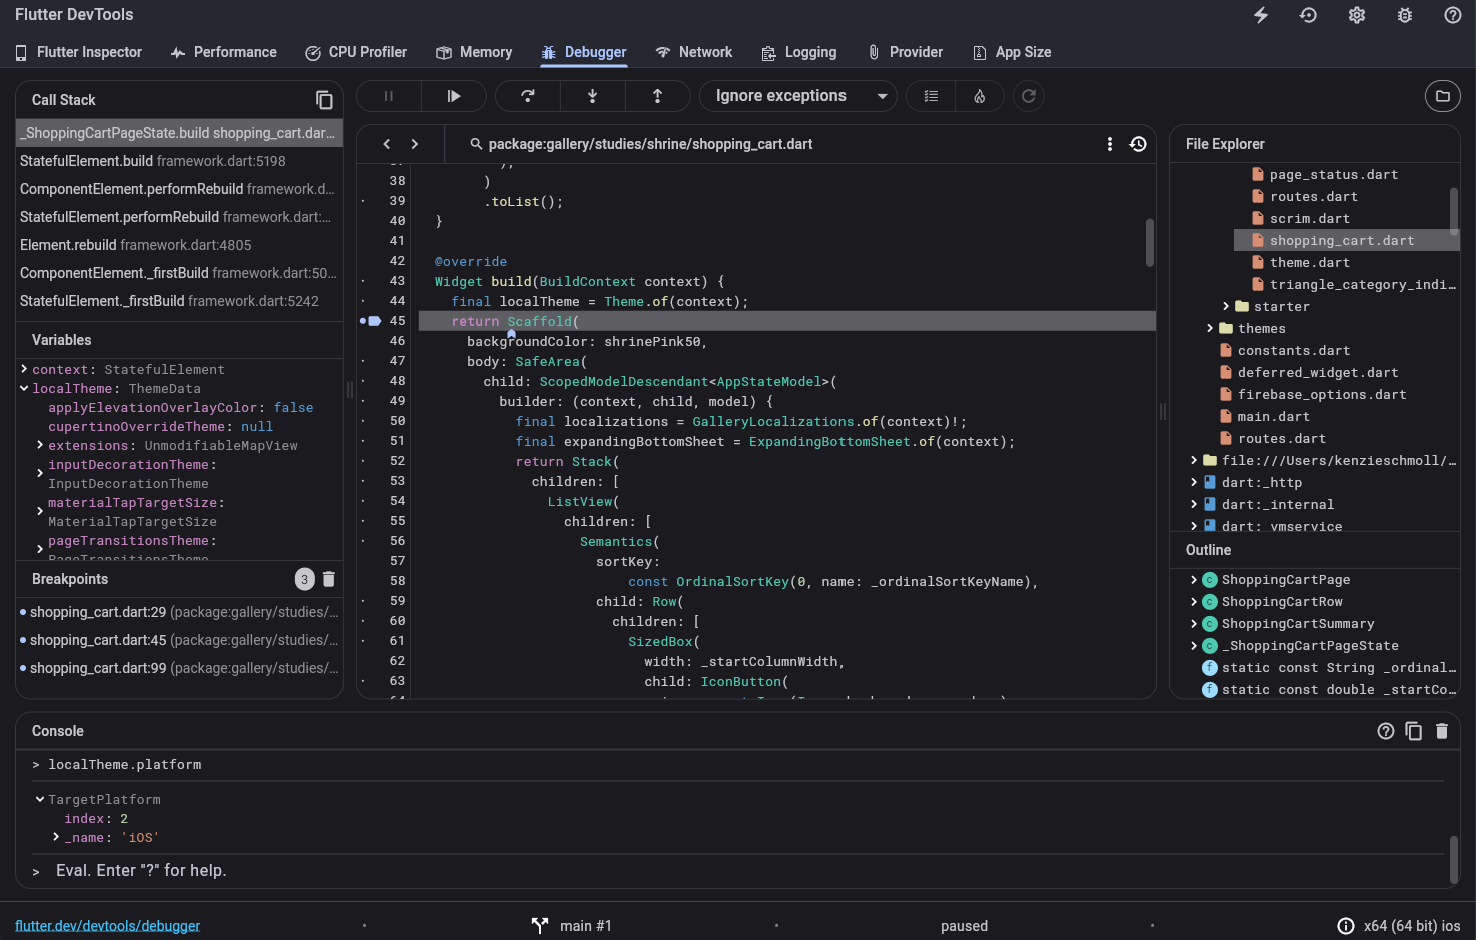
Introduce a known, non-critical bug. Trace through the code using breakpoints and watch expressions. Verify that the debugger provides accurate and timely information.
Record the configuration steps, resource limits, and any issues encountered. This documentation will help you replicate the setup for future debugging sessions and serve as a reference for your team.
Mistakes that break the result
Even with AI-assisted tools, a few common errors can turn a quick fix into a debugging nightmare. These mistakes don't just waste time; they often introduce new vulnerabilities or mask the root cause of the issue. Understanding these pitfalls is essential for maintaining code integrity while leveraging automation.
Ignoring Context Window Limits
AI debuggers rely on context windows to understand your codebase. When you paste too much code or irrelevant logs, the model's attention dilutes, leading to vague or incorrect suggestions. This is like trying to find a specific typo in a library by reading every book at once. Instead, isolate the failing function and its immediate dependencies. Provide only the relevant stack trace and the specific segment of code that triggers the error. This focused approach ensures the AI has the precise context needed to generate accurate fixes.
Overlooking False Positives
AI tools are powerful but not infallible. They may suggest refactoring code that works perfectly well or flag safe patterns as risky. Blindly accepting every suggestion can degrade performance or break existing functionality. Always review the proposed changes against your project’s coding standards and existing logic. If a suggestion feels overly complex or changes behavior you didn’t intend, question it. Treat AI as a junior developer who needs supervision, not an autonomous agent. Verify each change with unit tests or manual inspection before merging.
Neglecting Security Implications
Automated fixes might introduce security vulnerabilities, such as hardcoded credentials or unsafe data handling, to solve a syntactic error. AI models are trained on public data and may inadvertently suggest patterns that are outdated or insecure. Always scan the generated code with static analysis tools like SonarQube or Snyk. Ensure that any API keys, database connections, or user inputs handled by the suggested code follow your organization’s security protocols. A quick fix that compromises security is a debt you’ll pay later with interest.
Debugging tools: what to check next
Before integrating AI-powered debugging into your workflow, it helps to address the practical concerns that usually slow down adoption. The following answers cover compatibility, accuracy, and setup requirements for the most common scenarios.
No comments yet. Be the first to share your thoughts!