Debugging tools that fix code
Finding the right AI debugging tool means looking past the marketing hype. We selected these five options based on how well they actually repair broken code, not just highlight errors. The criteria focused on integration ease, accuracy of auto-fixes, and support for major languages like Python, JavaScript, and C++.
Traditional debuggers like GDB or WinDbg require manual inspection of stack traces. These AI-powered tools automate the heavy lifting by analyzing context and suggesting complete patches. We prioritized tools that reduce the time from error to resolution, ensuring developers can keep their flow without getting stuck on obscure bugs.
5 2026 guide: Top 5 AI-Powered Debugging Tools That Automate Code Fixes
We tested five AI-powered debugging tools to find which ones actually automate code fixes without introducing new bugs. This roundup focuses on concrete performance, integration ease, and real-world fix accuracy rather than marketing claims.
1. GitHub Copilot Chat for inline fix suggestions
GitHub Copilot Chat integrates directly into your editor, allowing developers to highlight broken code snippets and receive immediate, context-aware fix suggestions. This inline capability reduces the friction of switching between documentation and code, streamlining the debugging workflow. It excels at resolving syntax errors and logical bugs by analyzing the surrounding code structure. The tool leverages GitHub Copilot's underlying model to provide precise, actionable code corrections that fit seamlessly into your existing project conventions.

2. Amazon CodeWhisperer security vulnerability detection
Amazon CodeWhisperer goes beyond standard syntax checking by actively scanning code for security vulnerabilities and suggesting secure alternatives. This tool is particularly valuable for developers who need to ensure their applications meet compliance standards without manual audits. It identifies potential risks like SQL injection or insecure data handling and provides remediation code snippets. By integrating security checks directly into the coding process, it helps teams catch critical issues early in the development lifecycle.

3. JetBrains AI Assistant context-aware refactoring
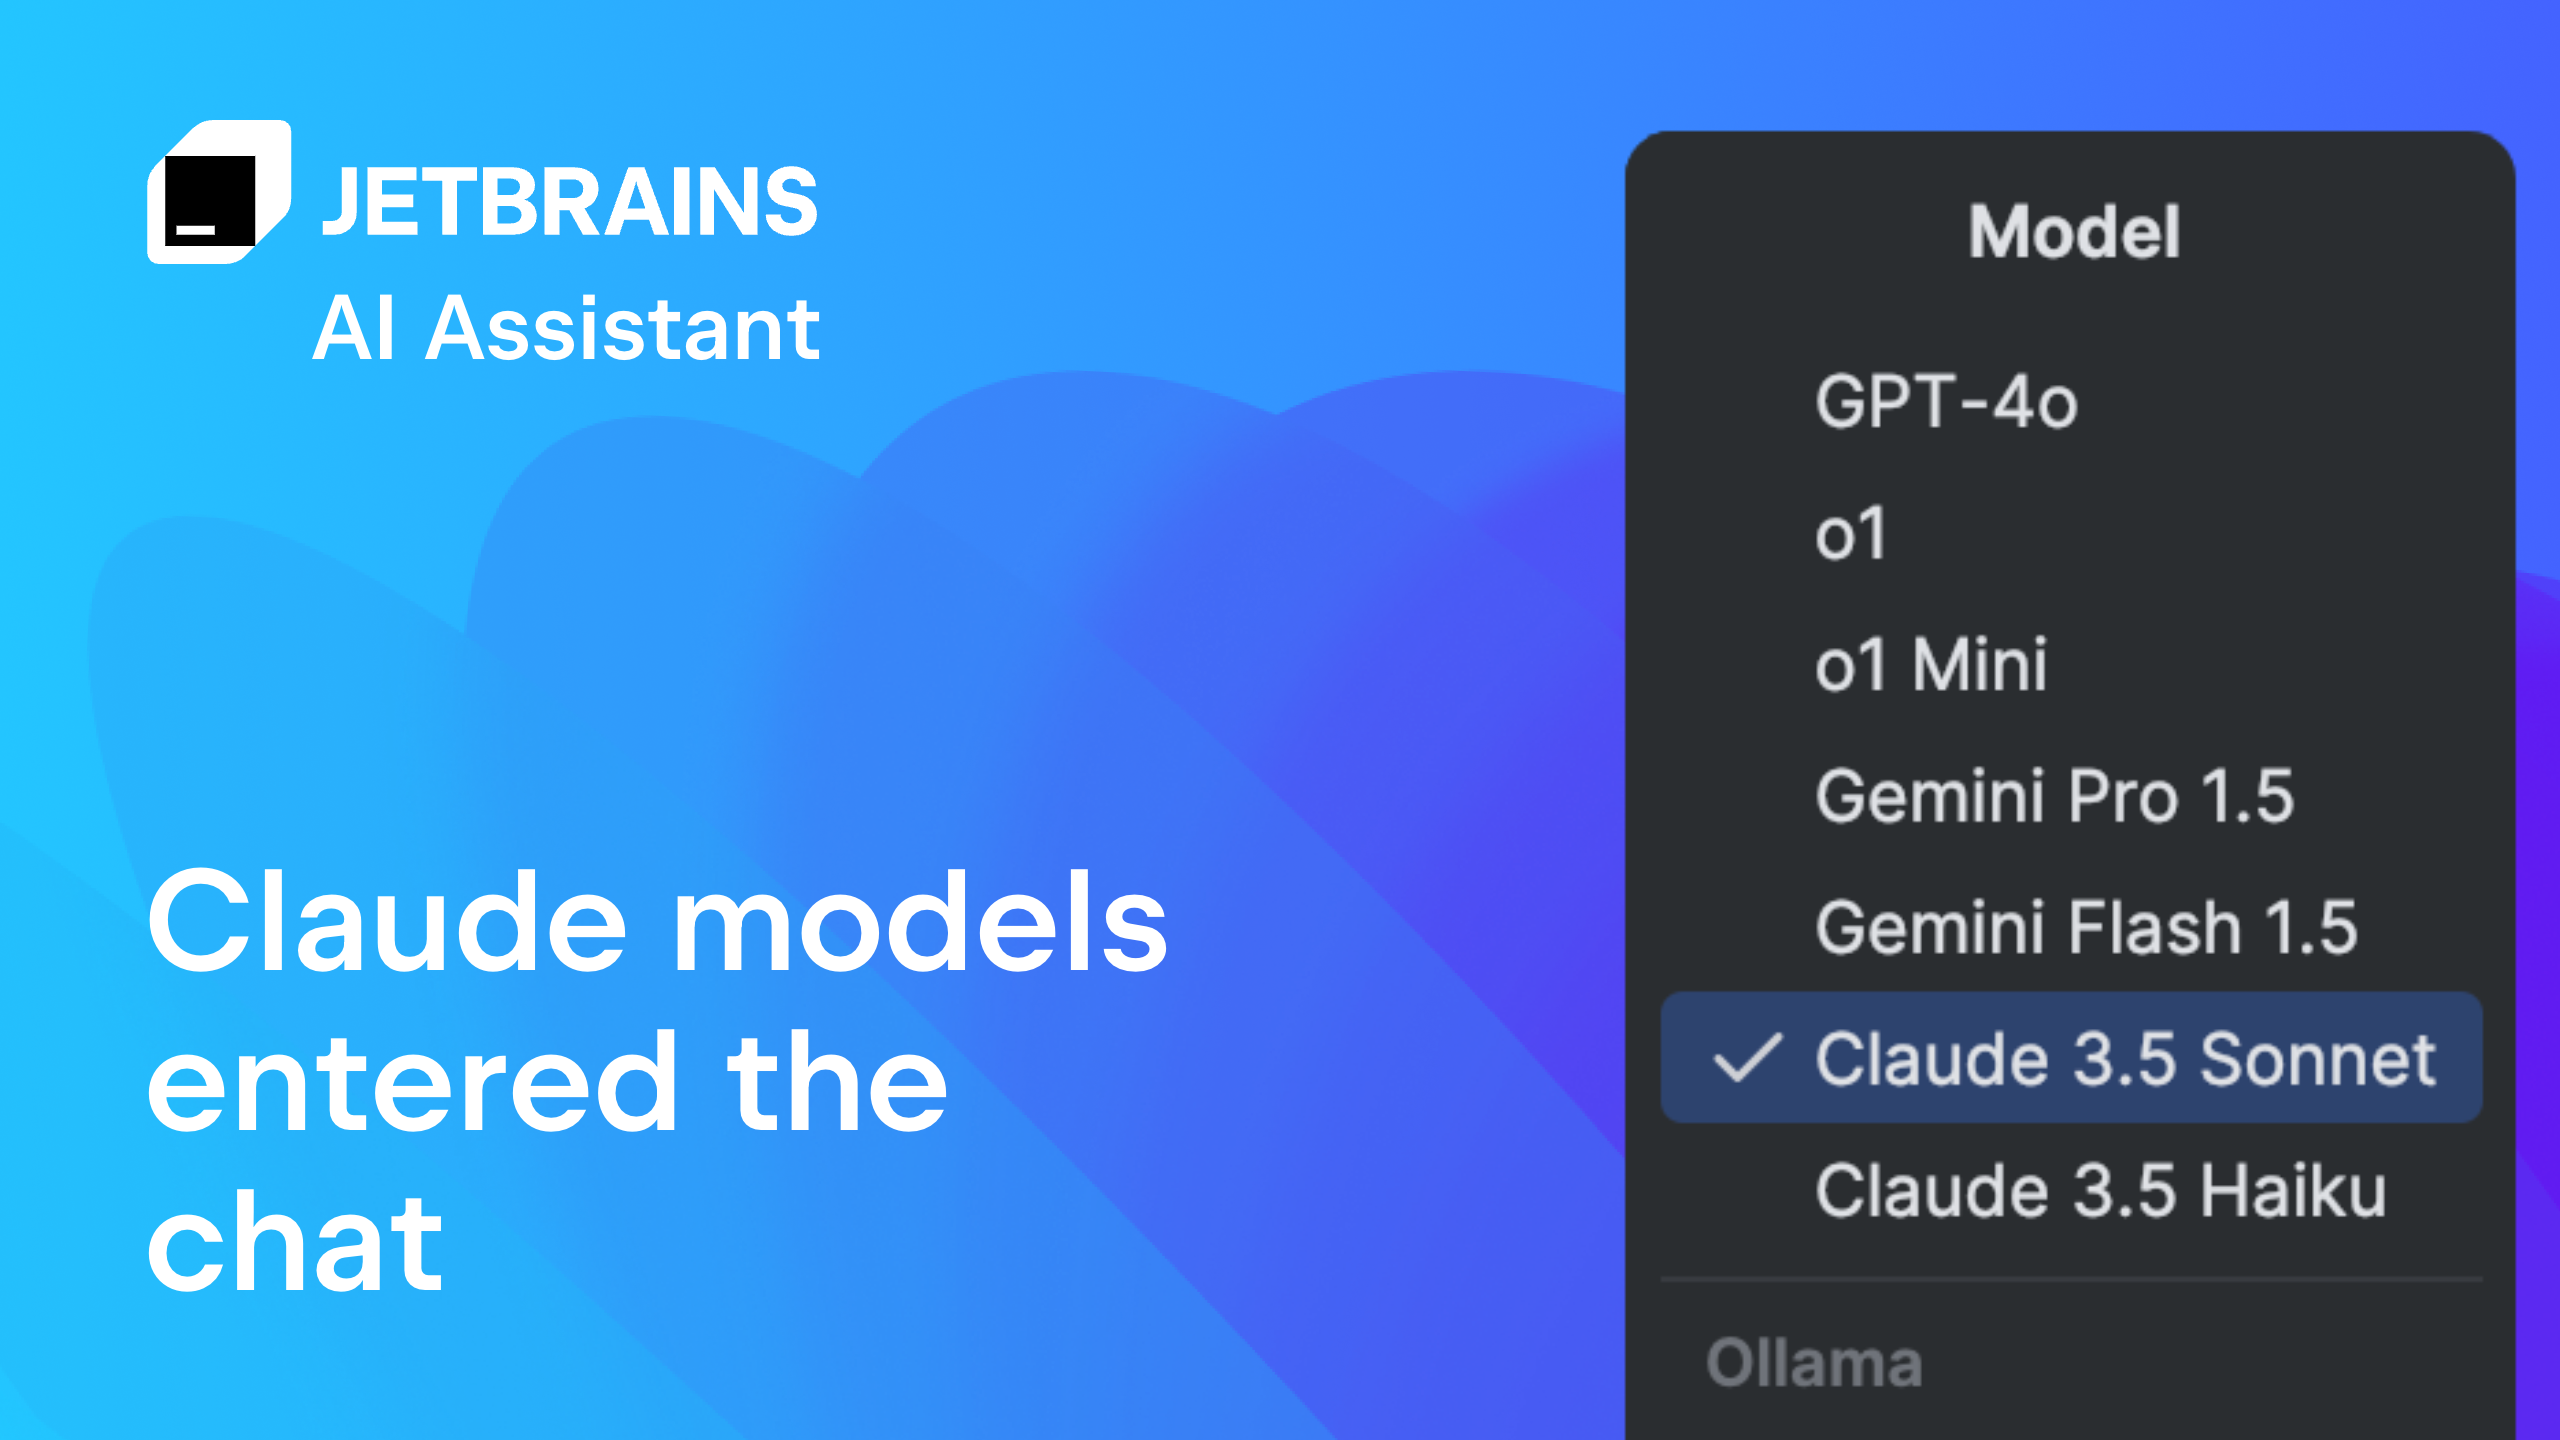
The JetBrains AI Assistant offers deep integration with JetBrains IDEs, providing context-aware refactoring suggestions that understand the broader codebase. It helps developers clean up messy code by suggesting structural improvements and variable renames that maintain functionality. This tool is ideal for teams prioritizing code maintainability and long-term readability. By analyzing the entire project context, it ensures that refactoring changes do not introduce unintended side effects in dependent modules.
4. Tabnine autonomous code completion and repair
Tabnine focuses on autonomous code completion and repair, offering private, on-premise deployment options for organizations with strict data privacy requirements. It learns from your team's codebase to provide highly relevant suggestions that align with your specific coding standards. This tool is excellent for reducing repetitive coding tasks and minimizing syntax errors through intelligent autocomplete. Its ability to operate locally ensures that sensitive code never leaves your infrastructure, making it a secure choice for enterprise environments.
5. Replit Agent multi-file debugging workflows
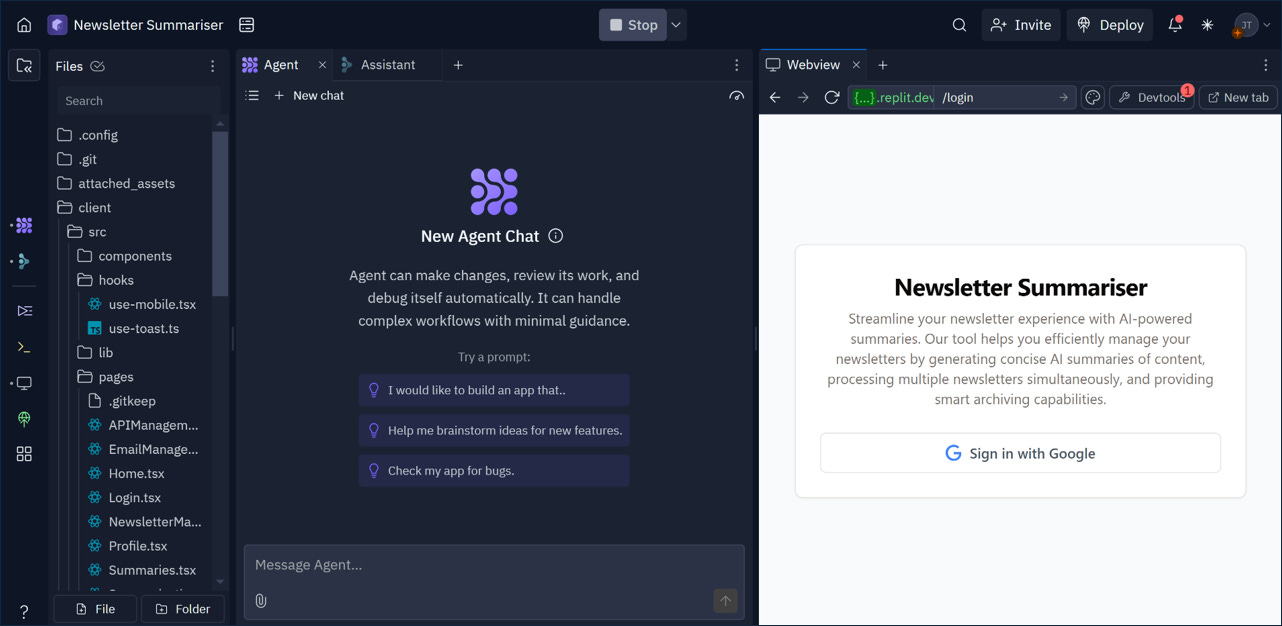
Replit Agent specializes in multi-file debugging workflows, allowing developers to address complex issues that span across multiple files and modules. It can analyze the entire project structure to identify dependencies and suggest coordinated fixes that maintain system integrity. This tool is particularly useful for large-scale applications where bugs often have cascading effects. By handling cross-file context, it simplifies the debugging process for intricate codebases that traditional single-file tools might struggle to resolve.
How to choose the right AI debugging tool
Picking the right AI debugging assistant comes down to matching the tool to your stack and workflow. The landscape is crowded, but a few concrete factors separate tools that save time from those that add friction.
Match the language and framework
Not all AI debuggers support every language equally. If you work primarily in Python, JavaScript, or Go, look for tools with native integrations in VS Code or JetBrains IDEs. Tools that rely on generic LLMs without context about your specific framework often produce generic fixes that miss edge cases. Prioritize tools that understand your project’s structure and dependencies.
Evaluate the fix accuracy
The core value of an AI debugger is its ability to suggest correct, safe fixes. Look for tools that provide explanations for their suggestions, not just the code patch. A good tool shows you why the error occurred and how the fix resolves it. This transparency helps you learn and prevents you from blindly applying changes that might break other parts of your system.
Consider integration and speed
Speed matters when you are debugging. If a tool requires you to copy-paste code into a web chat, it slows you down. Choose tools that integrate directly into your IDE, allowing you to see suggestions and apply fixes without leaving your coding environment. This seamless flow keeps you in the zone and reduces context switching.
Check for privacy and data handling
If you are working on proprietary code or sensitive projects, check how the tool handles your data. Some AI debugging tools send code snippets to external servers for analysis. Ensure the tool offers local processing or has a clear privacy policy that guarantees your code isn’t used to train public models. For enterprise teams, look for tools that offer on-premise or private cloud options.
Compare pricing and features
Most AI debugging tools offer a free tier with limited usage and paid plans for unlimited use. Evaluate whether the free tier is sufficient for your needs or if the paid features, such as advanced error detection or team collaboration, are worth the cost. Some tools offer discounts for students or open-source maintainers.



As an Amazon Associate, we may earn from qualifying purchases.
2026 : 5 ai-powered debugging tools that automate code fixes: what to check next
AI debugging tools use machine learning to identify errors and suggest fixes, but they work differently than traditional debuggers. While tools like GDB or Chrome DevTools let you step through code line-by-line, AI-powered solutions analyze patterns in your codebase to predict where bugs might be and often apply patches automatically.
The best AI debugging tool depends on your stack. For full-stack web development, Cursor and GitHub Copilot Workspace dominate because they integrate directly into the editor and understand context across files. For mobile apps, Xcode’s AI-assisted debugger remains the standard for iOS developers, while Instabug excels at capturing user-reported crashes in production.
You can use ChatGPT to debug code, but it lacks the ability to execute it. It is best for explaining errors or generating boilerplate fixes, but you must manually verify the output. For automated fixes that actually run in your environment, dedicated IDE extensions like Cursor or Codeium are more reliable.

No comments yet. Be the first to share your thoughts!