Budget fit for ai debugging tools 2026
Picking an AI debugging tool in 2026 means balancing feature depth against your team’s actual usage. Most platforms offer free tiers for small teams or individual developers, which is enough to evaluate core capabilities like trace visualization and prompt testing. For production-grade debugging, you will likely need a paid plan that scales with data volume and user count.
Consider the total cost of ownership, not just the monthly subscription. Some tools charge per trace or per event, which can add up quickly in high-traffic applications. Others offer flat-rate seats, which are more predictable for growing teams. Check if the tool integrates with your existing CI/CD pipeline to avoid hidden setup costs.
Look for tools that offer clear pricing structures without hidden fees for essential features like retention periods or team collaboration. Many providers offer discounts for annual commitments, which can significantly reduce the long-term cost. Start with a trial or free tier to test the tool’s impact on your debugging workflow before committing to a budget.
Shortlist real options
Finding the right debugging tool depends on whether you are fixing traditional code or navigating the non-deterministic behavior of AI agents. The following comparison highlights five platforms that consistently appear in 2026 evaluations for their specific strengths in observability, tracing, and error resolution.
| Tool | Primary Focus | Best For | Pricing Model |
|---|---|---|---|
| Braintrust | Evaluation & Testing | Measuring AI agent accuracy | Freemium |
| Maxim AI | Agent Tracing | Visualizing complex agent workflows | Usage-based |
| LangSmith | LLM Ops | LangChain developers | Tiered subscription |
| Arize Phoenix | Observability | Data science teams | Open source core |
| Helicone | Proxy & Logging | Cost monitoring | Pay-as-you-go |
Braintrust stands out for teams that need to quantify model performance. It functions less like a debugger and more like a testing suite, allowing you to create datasets and score agent responses against ground truth. This is essential when you need to prove that a new model version actually reduced hallucinations before deploying it.
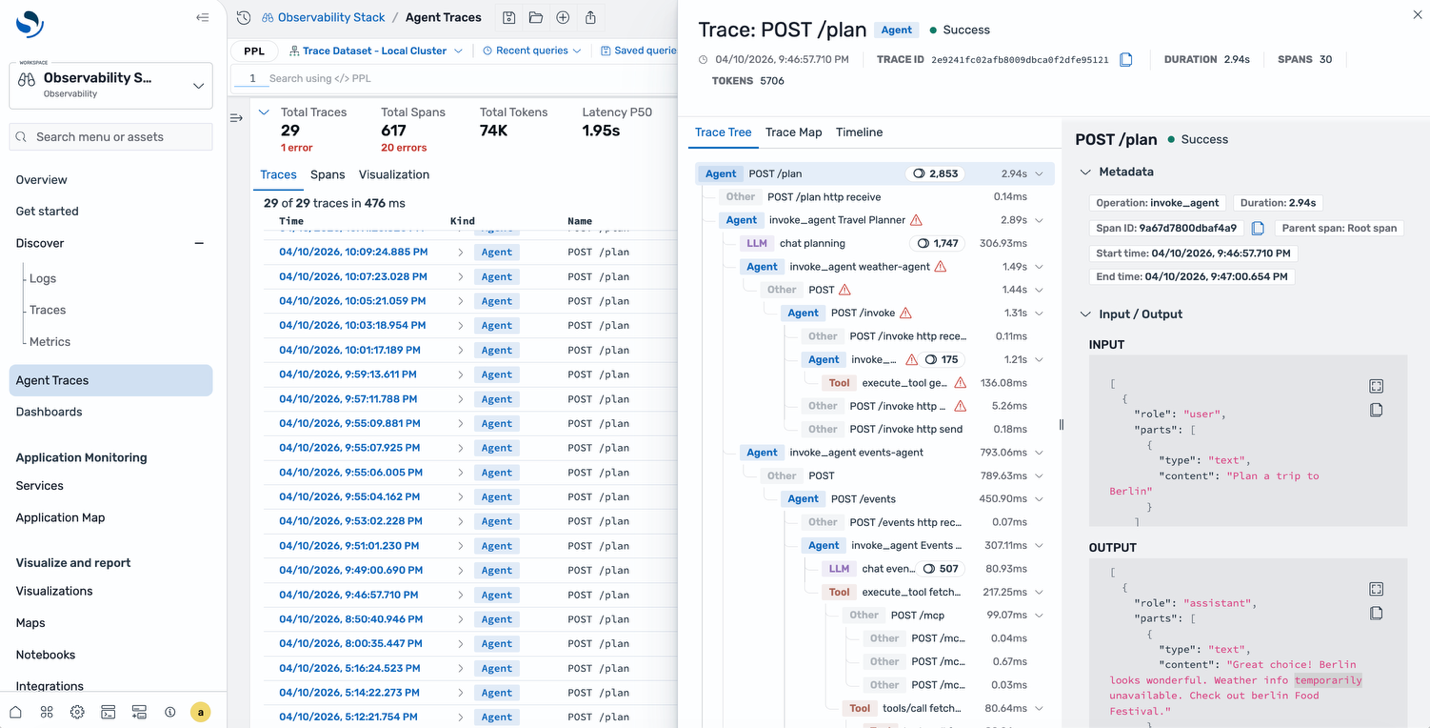
Maxim AI offers a different angle by focusing entirely on the visibility of agent actions. Instead of just showing you the final answer, it maps out every step the agent took, including tool calls and internal reasoning. This visual trace makes it easier to pinpoint exactly where an agent went off-track, which is often the hardest part of debugging autonomous systems.
For developers already using LangChain, LangSmith provides a seamless integration for tracing and debugging. It allows you to view individual traces, compare different model versions, and manage datasets directly within the platform. It is the go-to choice for teams building complex chains who need to see how data flows between components.
Arize Phoenix is built for data scientists who need deep observability into their ML pipelines. It offers a local-first approach to inspecting traces and embeddings, making it easy to debug without setting up complex infrastructure. This makes it a strong option for teams that want to analyze model behavior in real-time during development.
Helicone acts as a proxy for your LLM API calls, logging every request and response. It is particularly useful for monitoring costs and latency across your application. While it does not provide the same level of agent-specific insight as Maxim or Braintrust, it is a reliable tool for ensuring your AI infrastructure is running efficiently and within budget.


As an Amazon Associate, we may earn from qualifying purchases.
Inspect the expensive parts
Debugging AI agents is not about reading logs; it is about tracing the cost of failure. When an agent loops infinitely or hallucinates a tool call, the compute bill spikes faster than the error rate. You need a checklist that targets these high-cost failure points before they drain your budget.
Use this inspection routine to catch expensive bugs early.

Check if the agent is calling tools that no longer exist or have changed schemas. Invalid tool calls cause immediate retries and wasted inference tokens. Look for 404 errors or schema mismatch warnings in the trace.
Agents that get stuck in a loop between two tools burn money per second. Set a hard step limit in your tracing dashboard. If a trace exceeds the expected step count, flag it as a critical bug immediately.
Long conversations increase latency and cost. Inspect the context window size at each step. If the context grows without pruning, you are paying for stale history. Implement a summarization step or context window limit.
External APIs fail. Ensure your agent handles non-200 responses gracefully. Look for traces where the agent retries a failed external call without changing its strategy. This is a common source of wasted spend.

As an Amazon Associate, we may earn from qualifying purchases.
Plan for ownership costs
The sticker price of an AI debugging tool is rarely the final bill. Most platforms charge based on usage volume, storage retention, or the number of seats, which means costs can spike as your codebase grows. A tool that feels affordable during a small pilot often becomes expensive once it is integrated into your daily CI/CD pipeline.
Maintenance surprises often come from integration overhead. Tools that require complex setup or ongoing rule tuning demand engineering hours that don't show up on the invoice but drain your budget. If a platform requires constant manual configuration to remain useful, the hidden labor cost can outweigh the license fee.
When a cheap buy stops being cheap, it is usually because the tool fails to scale with your team. Look for pricing models that offer predictable tiers or volume discounts. Avoid platforms that charge per event or per log line if you generate high traffic, as these costs compound silently over time.

As an Amazon Associate, we may earn from qualifying purchases.
Ai debugging tools 2026: what to check next
Choosing an AI debugging tool for 2026 requires balancing integration depth with actionable insights. The market has shifted from simple error logging to agentic systems that suggest fixes, but not all tools fit every stack.
Do AI debugging tools replace manual code reviews?
No. AI tools like Sentry Seer or Datadog Bits AI accelerate detection, but they do not replace human context. They flag anomalies and suggest patches, but developers must still verify logic, security implications, and edge cases. Think of them as a pair programmer that never sleeps, not a replacement for your lead engineer.
Which tool is best for AI agent workflows?
For agentic workflows, Langfuse and Maxim AI are top contenders. They track non-deterministic outputs and latency across LLM calls. If you are debugging a simple API endpoint, traditional tools like New Relic Grok may suffice. For complex agent chains, you need observability that understands state changes.
How do these tools handle data privacy?
Privacy varies by vendor. Enterprise-grade tools like Dynatrace Davis AI offer on-premise deployment options for sensitive codebases. Open-source or cloud-native tools may process telemetry on external servers. Always review the data retention policy and encryption standards before integrating into your CI/CD pipeline.

No comments yet. Be the first to share your thoughts!