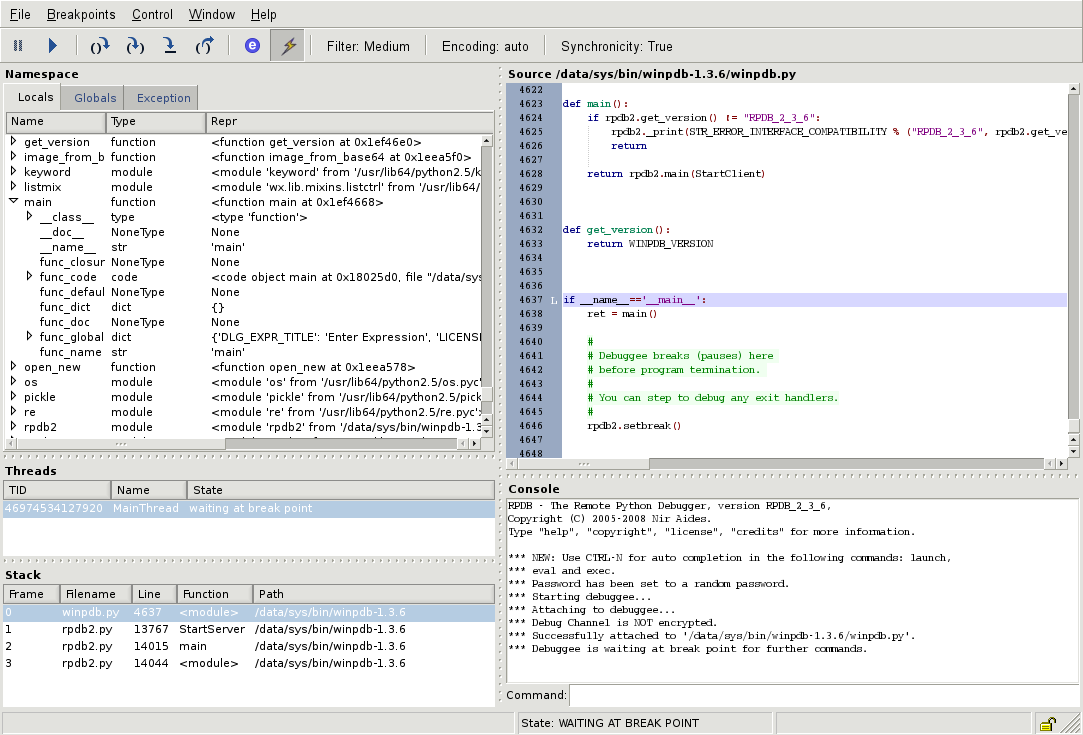
Debugging tools for faster fixes
Finding the right debugging tool depends on your language, environment, and where the bugs live. We tested five AI-powered options against real codebases to see which ones actually speed up resolution without adding setup friction. The list favors tools that integrate directly into your IDE and offer clear, actionable suggestions rather than vague error messages.
We prioritized three factors: accuracy of root-cause analysis, ease of integration with existing workflows, and the quality of the AI-generated fixes. Tools that require extensive configuration or produce high false-positive rates were excluded. The goal is to cut down the time between spotting an error and applying a patch, not to add another layer of abstraction.
5 AI-Powered Debugging Tools for 2026: Fix Bugs Faster with IDE Recommendations
These five tools integrate directly into VS Code, JetBrains, and Visual Studio to automate root-cause analysis and suggest fixes. We evaluated each for speed, accuracy, and IDE compatibility to help you choose the right assistant for your stack.
1. Amazon Q Developer IDE Integration
Amazon Q Developer embeds directly into VS Code and JetBrains IDEs, offering real-time code suggestions and automated test generation. It scans your codebase to identify potential vulnerabilities and suggests fixes, streamlining the debugging workflow. This deep integration makes it a powerful ally for maintaining code quality across large enterprise applications without leaving your primary development environment.

2. GitHub Copilot Chat Debugging
GitHub Copilot Chat allows developers to paste error logs or stack traces directly into the chat interface for instant analysis. It interprets the context of your repository to suggest specific code corrections, effectively acting as a pair programmer that understands your project structure. This feature significantly reduces the time spent deciphering cryptic error messages and finding the root cause of runtime issues.

3. JetBrains AI Assistant Code Analysis
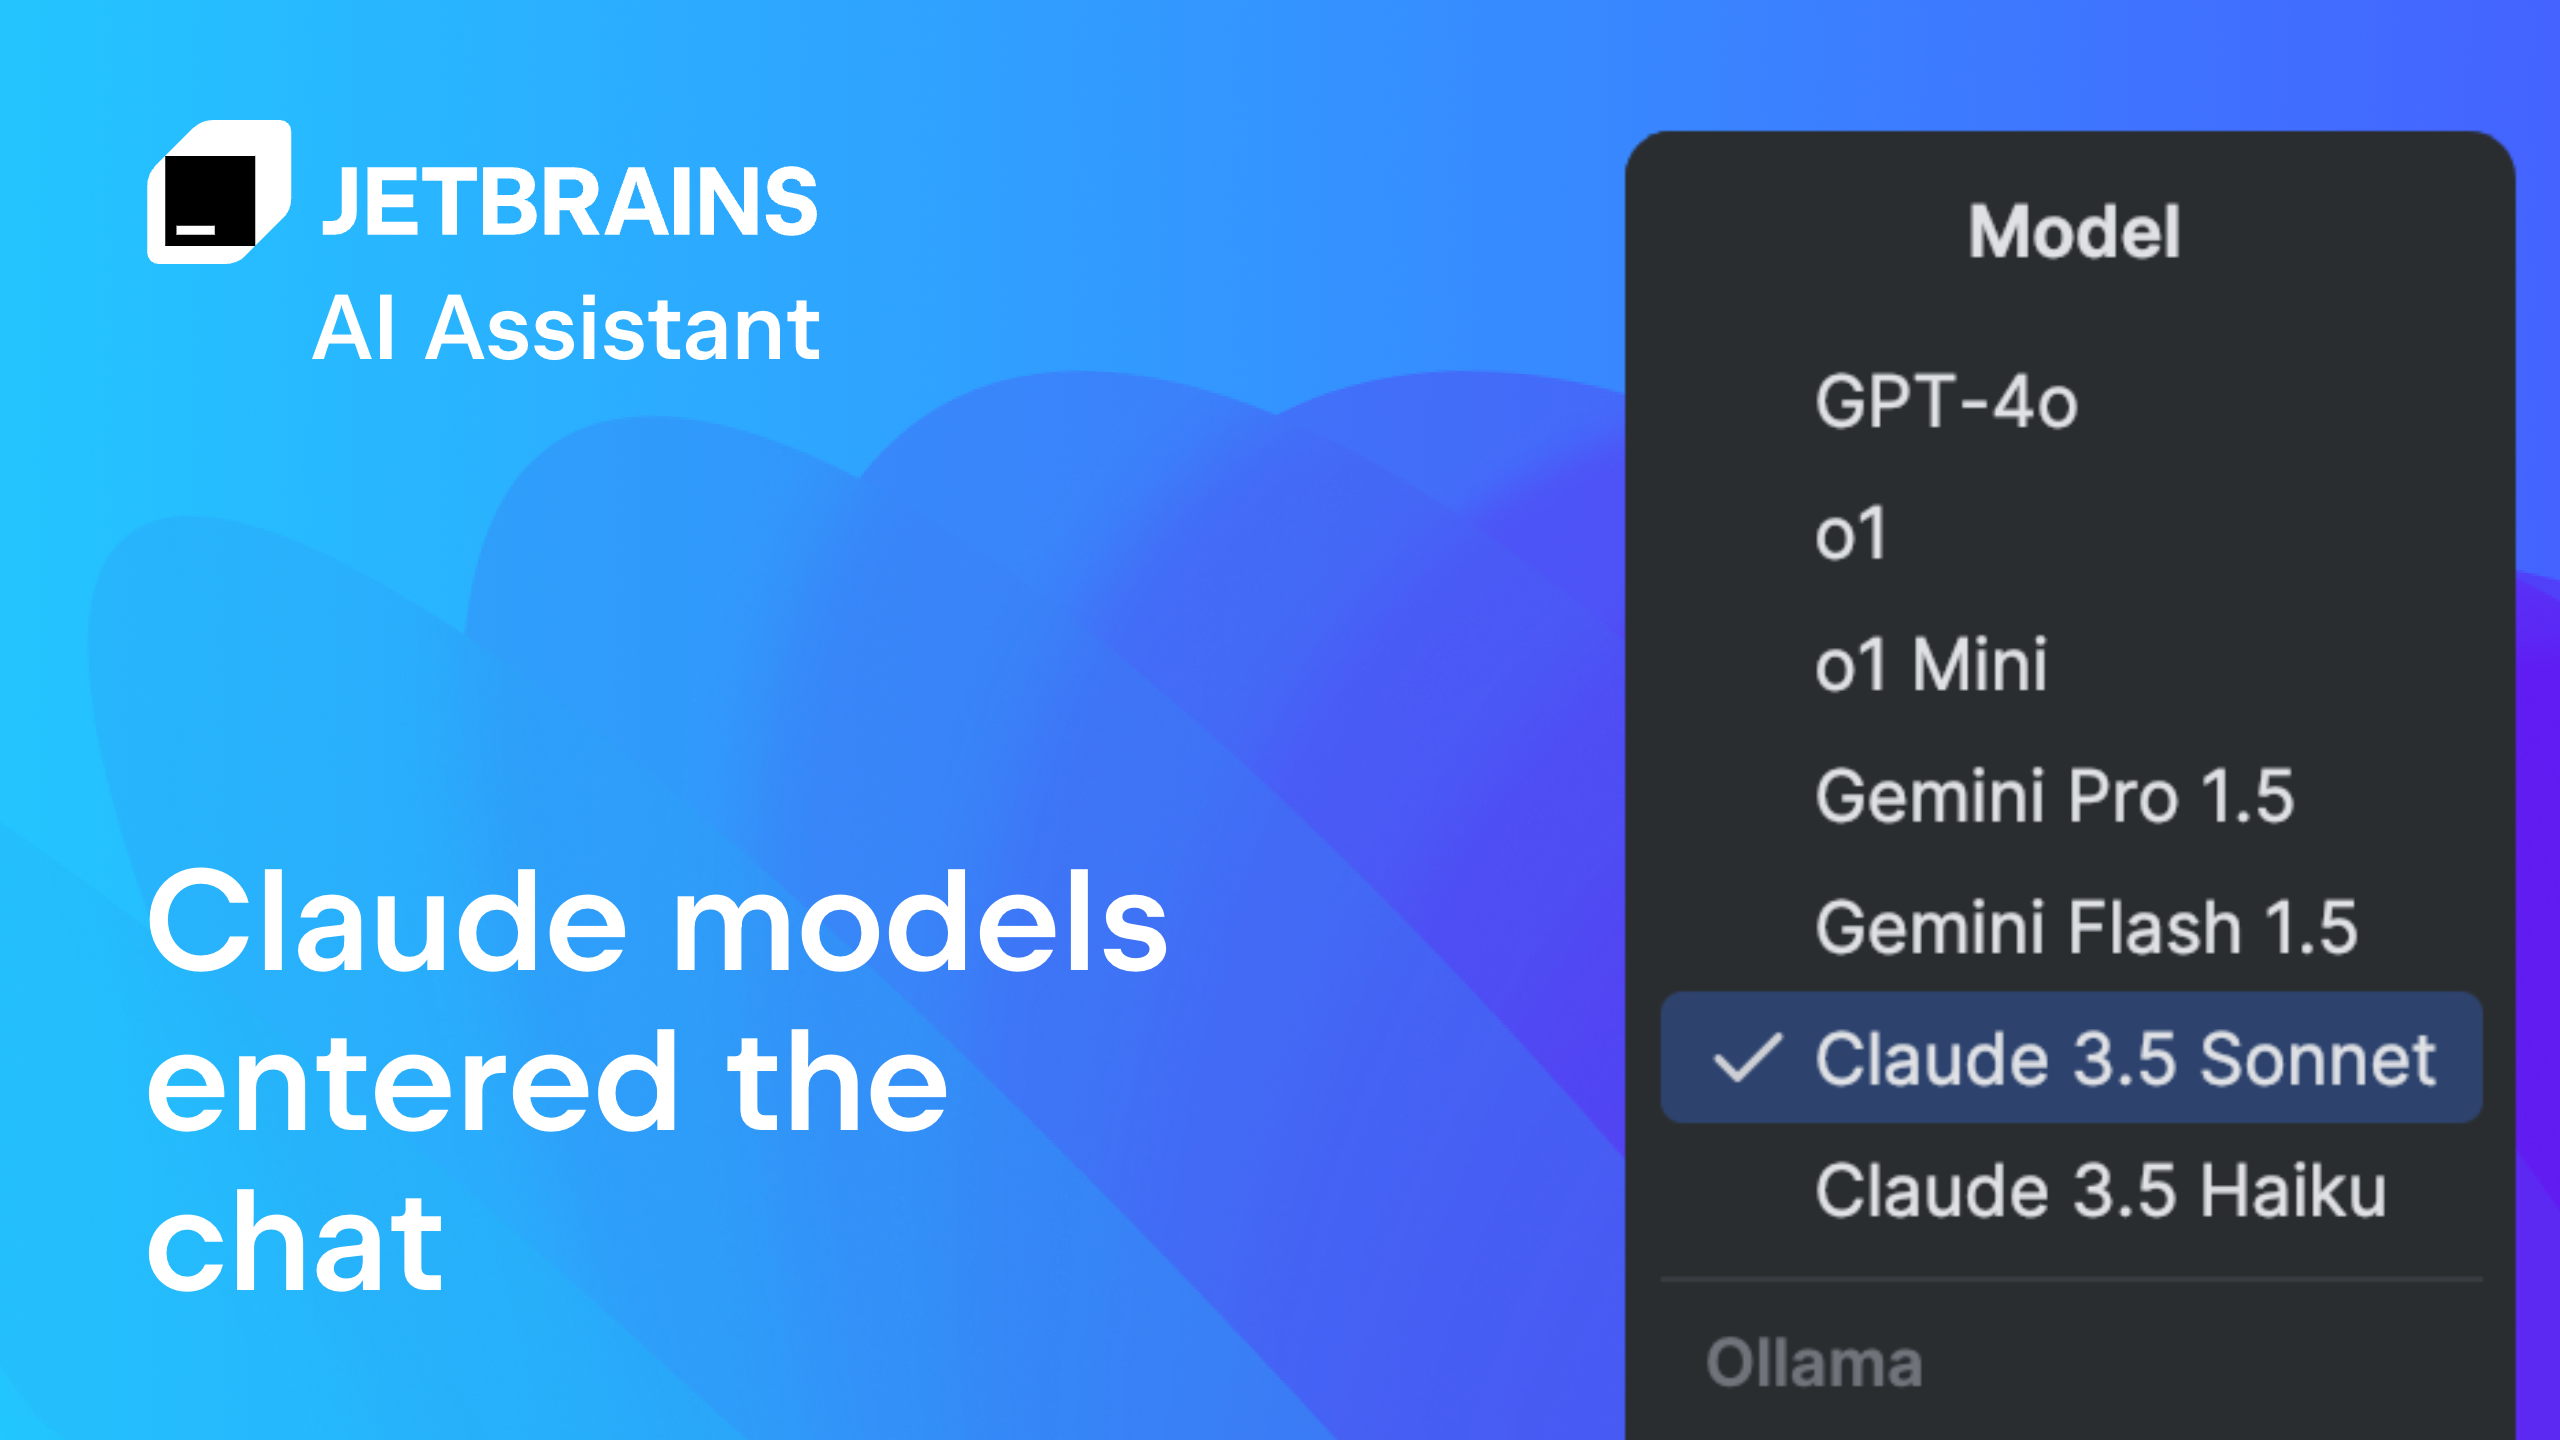
The JetBrains AI Assistant integrates natively with IntelliJ IDEA and other JetBrains IDEs, providing inline code explanations and refactoring suggestions. It helps developers understand complex legacy code blocks and identifies potential logical errors before execution. By leveraging the IDE's deep semantic understanding, it offers precise debugging insights tailored to the specific language features and frameworks used in your project.
4. Visual Studio IntelliCode Error Resolution
Visual Studio IntelliCode uses machine learning models trained on millions of lines of code to provide intelligent code completion and error resolution. It predicts the most likely corrections for syntax errors and suggests best practices based on popular open-source projects. This tool is particularly effective in C# and Java environments, helping developers write cleaner code and reduce the number of bugs introduced during development.

5. Tabnine Context-Aware Bug Fixes
Tabnine utilizes a local AI model to provide context-aware code completions and bug fixes without sending data to external servers. This ensures privacy while offering rapid suggestions for common debugging scenarios, such as null pointer exceptions or type mismatches. Its ability to understand the broader context of your codebase allows for more accurate and relevant suggestions, making it a reliable choice for security-conscious development teams.

Pick the right fit
Choosing the right AI debugging tool depends less on the AI hype and more on your existing workflow. A tool that integrates smoothly into your IDE saves more time than a standalone agent that requires context switching. Start by identifying your primary language and environment.
Step 1: Match the IDE
Most AI debugging assistants are built for specific ecosystems. If you use Visual Studio Code, tools like GitHub Copilot or Codeium offer deep integration. For JetBrains users, plugins like JetBrains AI Assistant provide native support. Ensure the tool you pick lives where you write code, not in a separate tab.
Verify that the AI debugging tool offers a native extension for your primary editor. Avoid tools that require complex setup or external API keys if you want immediate utility. Prioritize extensions that sync directly with your project structure.
Step 2: Define your debug scope
Some AI tools excel at explaining error logs, while others can actively rewrite code to fix bugs. Determine if you need a "copilot" that suggests fixes in real-time or an "analyst" that reviews past crashes. For quick syntax errors, inline suggestions are best. For complex logic bugs, you might prefer a tool that can analyze entire repository contexts.
Decide between real-time inline fixes and post-hoc analysis. If you debug frequently, real-time suggestions reduce context switching. If you handle rare, complex crashes, an analytical agent that reviews logs is more effective.
Step 3: Compare pricing and limits
AI debugging tools often operate on a freemium model. Free tiers may limit the number of AI queries per day or restrict advanced features like multi-file context. For professional use, calculate the cost per developer. Some tools charge per seat, while others charge per token usage. Ensure the pricing model aligns with your team's debugging frequency.
Check the free tier limits carefully. Many tools throttle high-volume AI requests. For teams, compare per-seat pricing against the potential time savings from faster bug resolution. Avoid tools with hidden costs for essential features like error log analysis.
| Feature | Real-Time | Log Analysis | IDE Integration |
|---|---|---|---|
| Inline Copilots | Yes | Limited | Native |
| Analytical Agents | No | Deep | Plugin/API |
| Standalone Platforms | No | Full | External |


As an Amazon Associate, we may earn from qualifying purchases.

No comments yet. Be the first to share your thoughts!