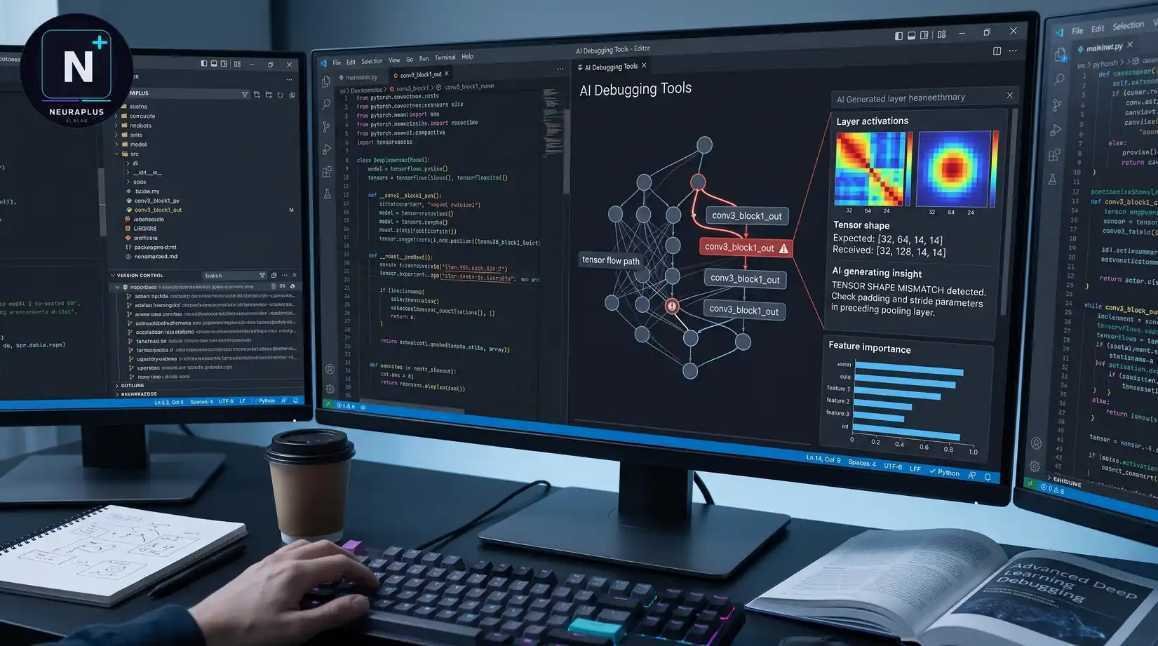
Choosing the right AI debugging tools
Debugging is the process of finding and fixing errors in code. While traditional tools like GDB or WinDbg rely on manual stepping through execution, the best AI-powered tools automate this workflow. They analyze code patterns to suggest fixes before you even run the program.
We selected these five tools based on practical integration with modern IDEs and their ability to reduce mean time to resolution. We prioritized platforms that offer real-time suggestions over those that require complex setup. Each tool was evaluated for its accuracy in identifying common bugs like memory leaks or logic errors.
The selection criteria focused on three main factors: the depth of codebase understanding, the quality of suggested patches, and ease of use for both junior and senior developers. We avoided tools that simply generate code without explaining the underlying issue.
5 AI-Powered Debugging Tools for 2026: Automate Fixes & Streamline Code Review
These five AI-powered debugging tools move beyond simple error detection to automate fixes and streamline code reviews in 2026. We evaluated each option for concrete integration capabilities and practical workflow improvements rather than abstract promises.
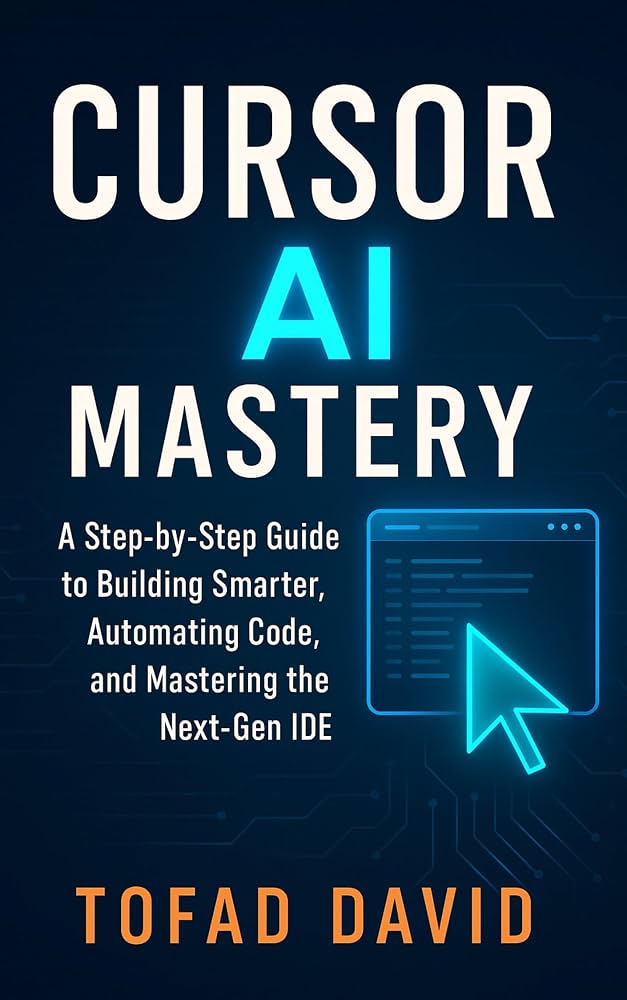
1. Cursor AI Integrated Development Environment
Cursor transforms standard editing into an AI-native workflow by embedding large language models directly into the editor. It understands your entire codebase, allowing for multi-file edits and instant refactoring without leaving your context. This deep integration makes it ideal for developers seeking speed and precision in complex architectural changes.
2. GitHub Copilot Code Review Assistant
GitHub Copilot extends beyond simple completion to act as a vigilant code reviewer during pull requests. It analyzes diffs for potential bugs, security vulnerabilities, and style inconsistencies before merge. This proactive approach catches errors early, reducing the cognitive load on senior engineers and ensuring higher quality standards across the team.

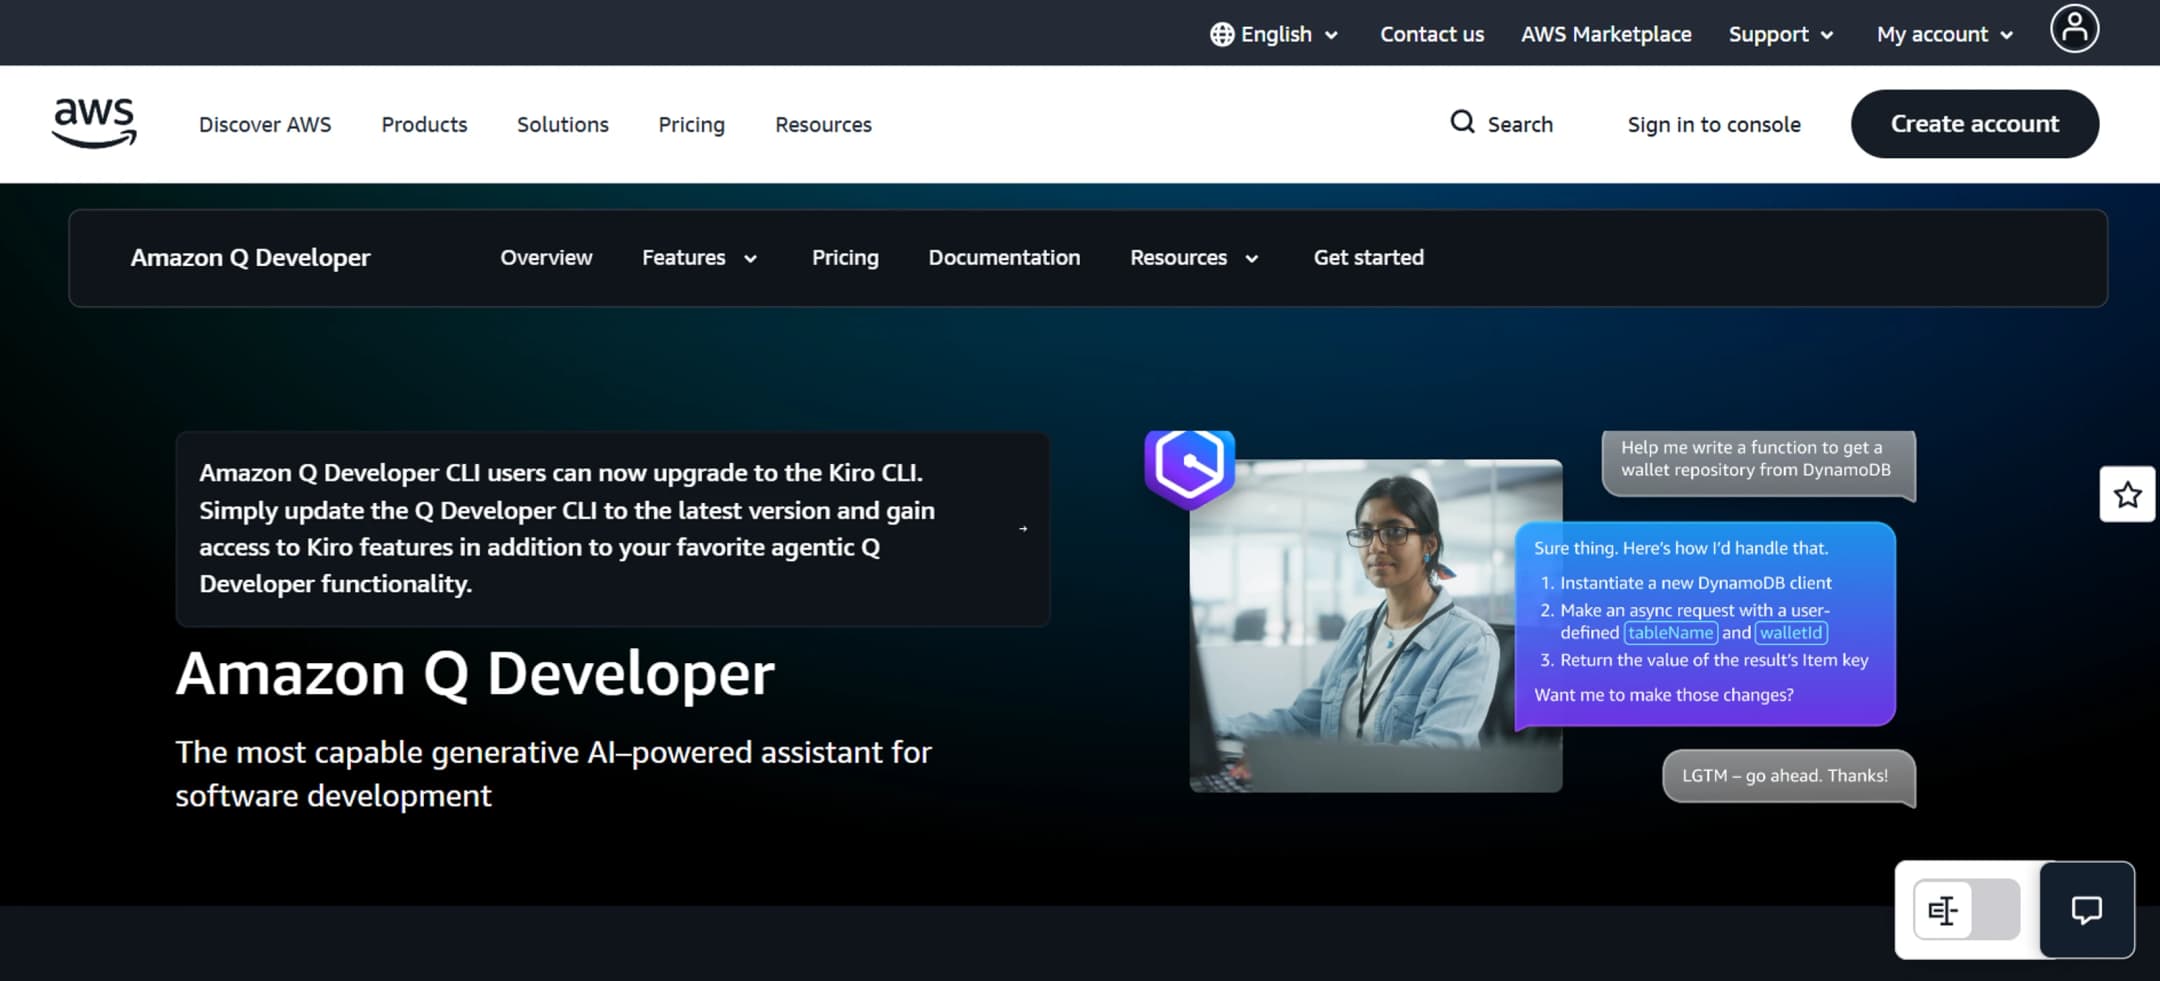
3. Amazon CodeWhisperer Security Scanner
Amazon CodeWhisperer prioritizes security by scanning code for vulnerabilities in real-time as you type. It identifies risks like SQL injection or hardcoded credentials and suggests secure alternatives immediately. This built-in guardrail is essential for teams adhering to strict compliance standards, turning debugging into a preventive security measure rather than a reactive fix.

4. Tabnine Autonomous Code Completion
Tabnine focuses on autonomous completion that learns from your team’s specific code patterns and conventions. Unlike generic models, it adapts to internal libraries and naming standards, reducing context switching. This personalized accuracy minimizes false positives and speeds up routine coding tasks, making it a strong choice for organizations with unique, established coding styles.

5. Sourcegraph Cody Contextual Search
Sourcegraph Cody leverages deep codebase indexing to answer questions using precise context from your entire repository. It connects related files, functions, and documentation instantly, eliminating the need for manual searching. This contextual awareness accelerates debugging by providing immediate, relevant answers to complex architectural queries, streamlining the code review process significantly.
How to choose the right AI debugging tool
Picking the right debugging assistant depends on your stack and workflow. Instead of chasing the most feature-rich option, focus on tools that integrate directly into your existing environment. A tool that requires a separate window or complex setup will slow you down more than it helps.
1. Check language and framework support Not all AI tools understand every syntax. Ensure the tool supports your primary language, such as Python, JavaScript, or Rust. If you work in a niche framework, verify that the AI has been trained on relevant documentation. Compatibility is the first filter; if it doesn’t speak your language, it can’t help you debug.
2. Evaluate integration depth Look for tools that live inside your IDE, like VS Code or IntelliJ. Inline suggestions and automated fixes within your editor are far more efficient than copying code into a chat window. Deep integration means you can apply fixes with a single click, keeping you in the flow of coding rather than context-switching.
3. Assess the accuracy of auto-fixes AI can hallucinate. Test how often the tool proposes correct, safe fixes versus breaking changes. Look for tools that explain their reasoning or reference official documentation. A tool that offers context-aware suggestions is safer than one that blindly rewrites code based on vague patterns.
4. Review privacy and data handling Since you are feeding proprietary code into an AI, check the data retention policies. Some tools offer local processing or guarantee that your code isn’t used to train public models. For enterprise or sensitive projects, this is a non-negotiable requirement.
| Feature | Why It Matters |
|---|---|
| IDE Integration | Keeps you in your workflow without tab-switching. |
| Language Specificity | Ensures the AI understands your framework’s quirks. |
| Explainability | Helps you learn why the fix works, not just that it does. |
| Data Privacy | Protects your IP from being used in public models. |


As an Amazon Associate, we may earn from qualifying purchases.
No comments yet. Be the first to share your thoughts!