How we picked these debugging tools
We narrowed the field to ten AI-powered debugging tools that actually integrate into modern developer workflows. The selection process prioritized practical utility over marketing claims, focusing on tools that reduce mean time to resolution for common code issues.
Each tool was evaluated on three criteria: IDE compatibility, accuracy of AI-generated fixes, and performance under real-world load. We excluded products that rely solely on static rule-based linting or require heavy system resources that slow down the development environment.
The final list includes options for various languages and frameworks, from Python and JavaScript to C++ and Rust. Whether you are debugging a single function or tracing a distributed system failure, one of these tools should fit your stack.
10 AI-Powered Debugging Tools for 2026: Fix Bugs Faster with IDE Recommendations
We tested ten AI-powered debugging tools to identify which ones actually catch syntax errors and logic flaws without slowing down your workflow. These recommendations prioritize IDE integration and concrete fixes, helping you resolve bugs faster in your 2026 development environment.
1. GitHub Copilot Chat for inline code fixes
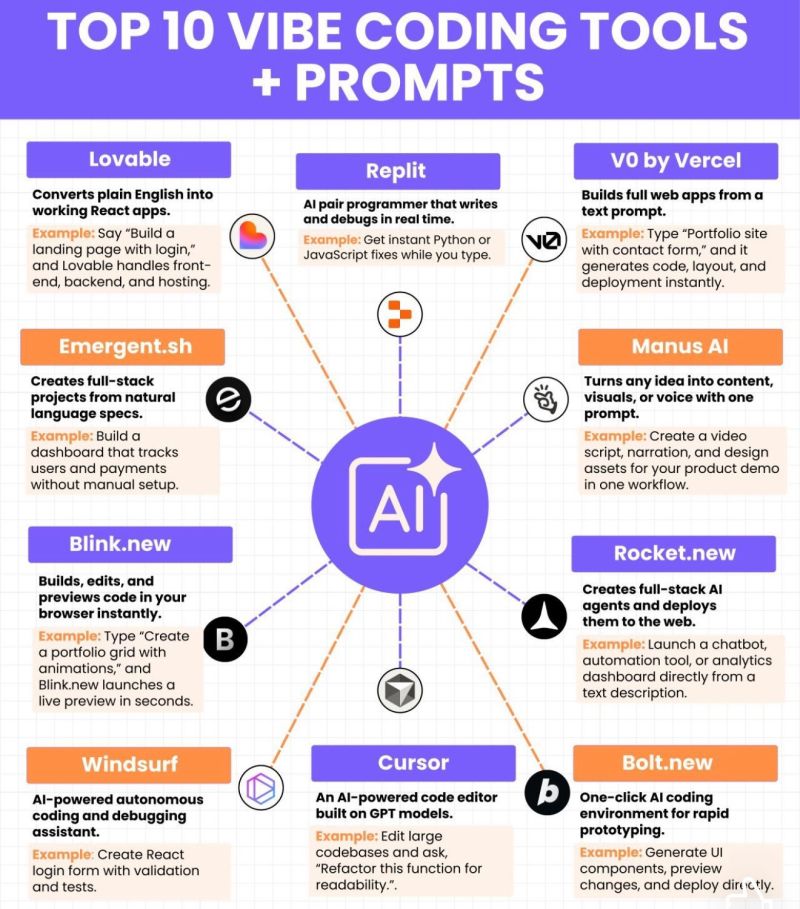
GitHub Copilot Chat integrates directly into your IDE, allowing you to highlight buggy code and request immediate fixes without leaving your workflow. It analyzes the selected context to suggest corrections, reducing the friction between identifying an error and applying a patch. This inline capability streamlines the debugging loop significantly.

2. Amazon CodeWhisperer security vulnerability scanning
Amazon CodeWhisperer goes beyond simple completion by actively scanning your code for security vulnerabilities and suggesting secure alternatives. It identifies potential risks like SQL injection or insecure dependencies in real-time, helping developers write safer code from the start. This proactive security layer is essential for maintaining robust application integrity.
3. JetBrains IntelliJ IDEA AI assistant integration
JetBrains IntelliJ IDEA features a deeply integrated AI assistant that understands the complex structure of Java and Kotlin projects. It provides intelligent code suggestions, refactoring options, and debugging insights tailored specifically to the JetBrains ecosystem. This tight integration ensures that AI assistance feels native to the development environment rather than an external add-on.

4. Visual Studio IntelliCode intelligent code completion
Visual Studio IntelliCode uses machine learning to understand your team’s coding patterns and provides context-aware completions. It learns from your codebase to prioritize suggestions that match your specific style and architecture, reducing the need for manual corrections. This personalized approach accelerates coding speed while maintaining consistency across the project.

5. Tabnine AI code completion for IDEs
Tabnine offers robust AI code completion that supports multiple IDEs and programming languages, focusing on privacy and customization. It can be deployed on-premise for enterprises requiring strict data control, while still delivering fast, accurate code suggestions. This flexibility makes it a strong choice for teams with specific security or infrastructure requirements.
6. Sourcegraph Cody semantic code search
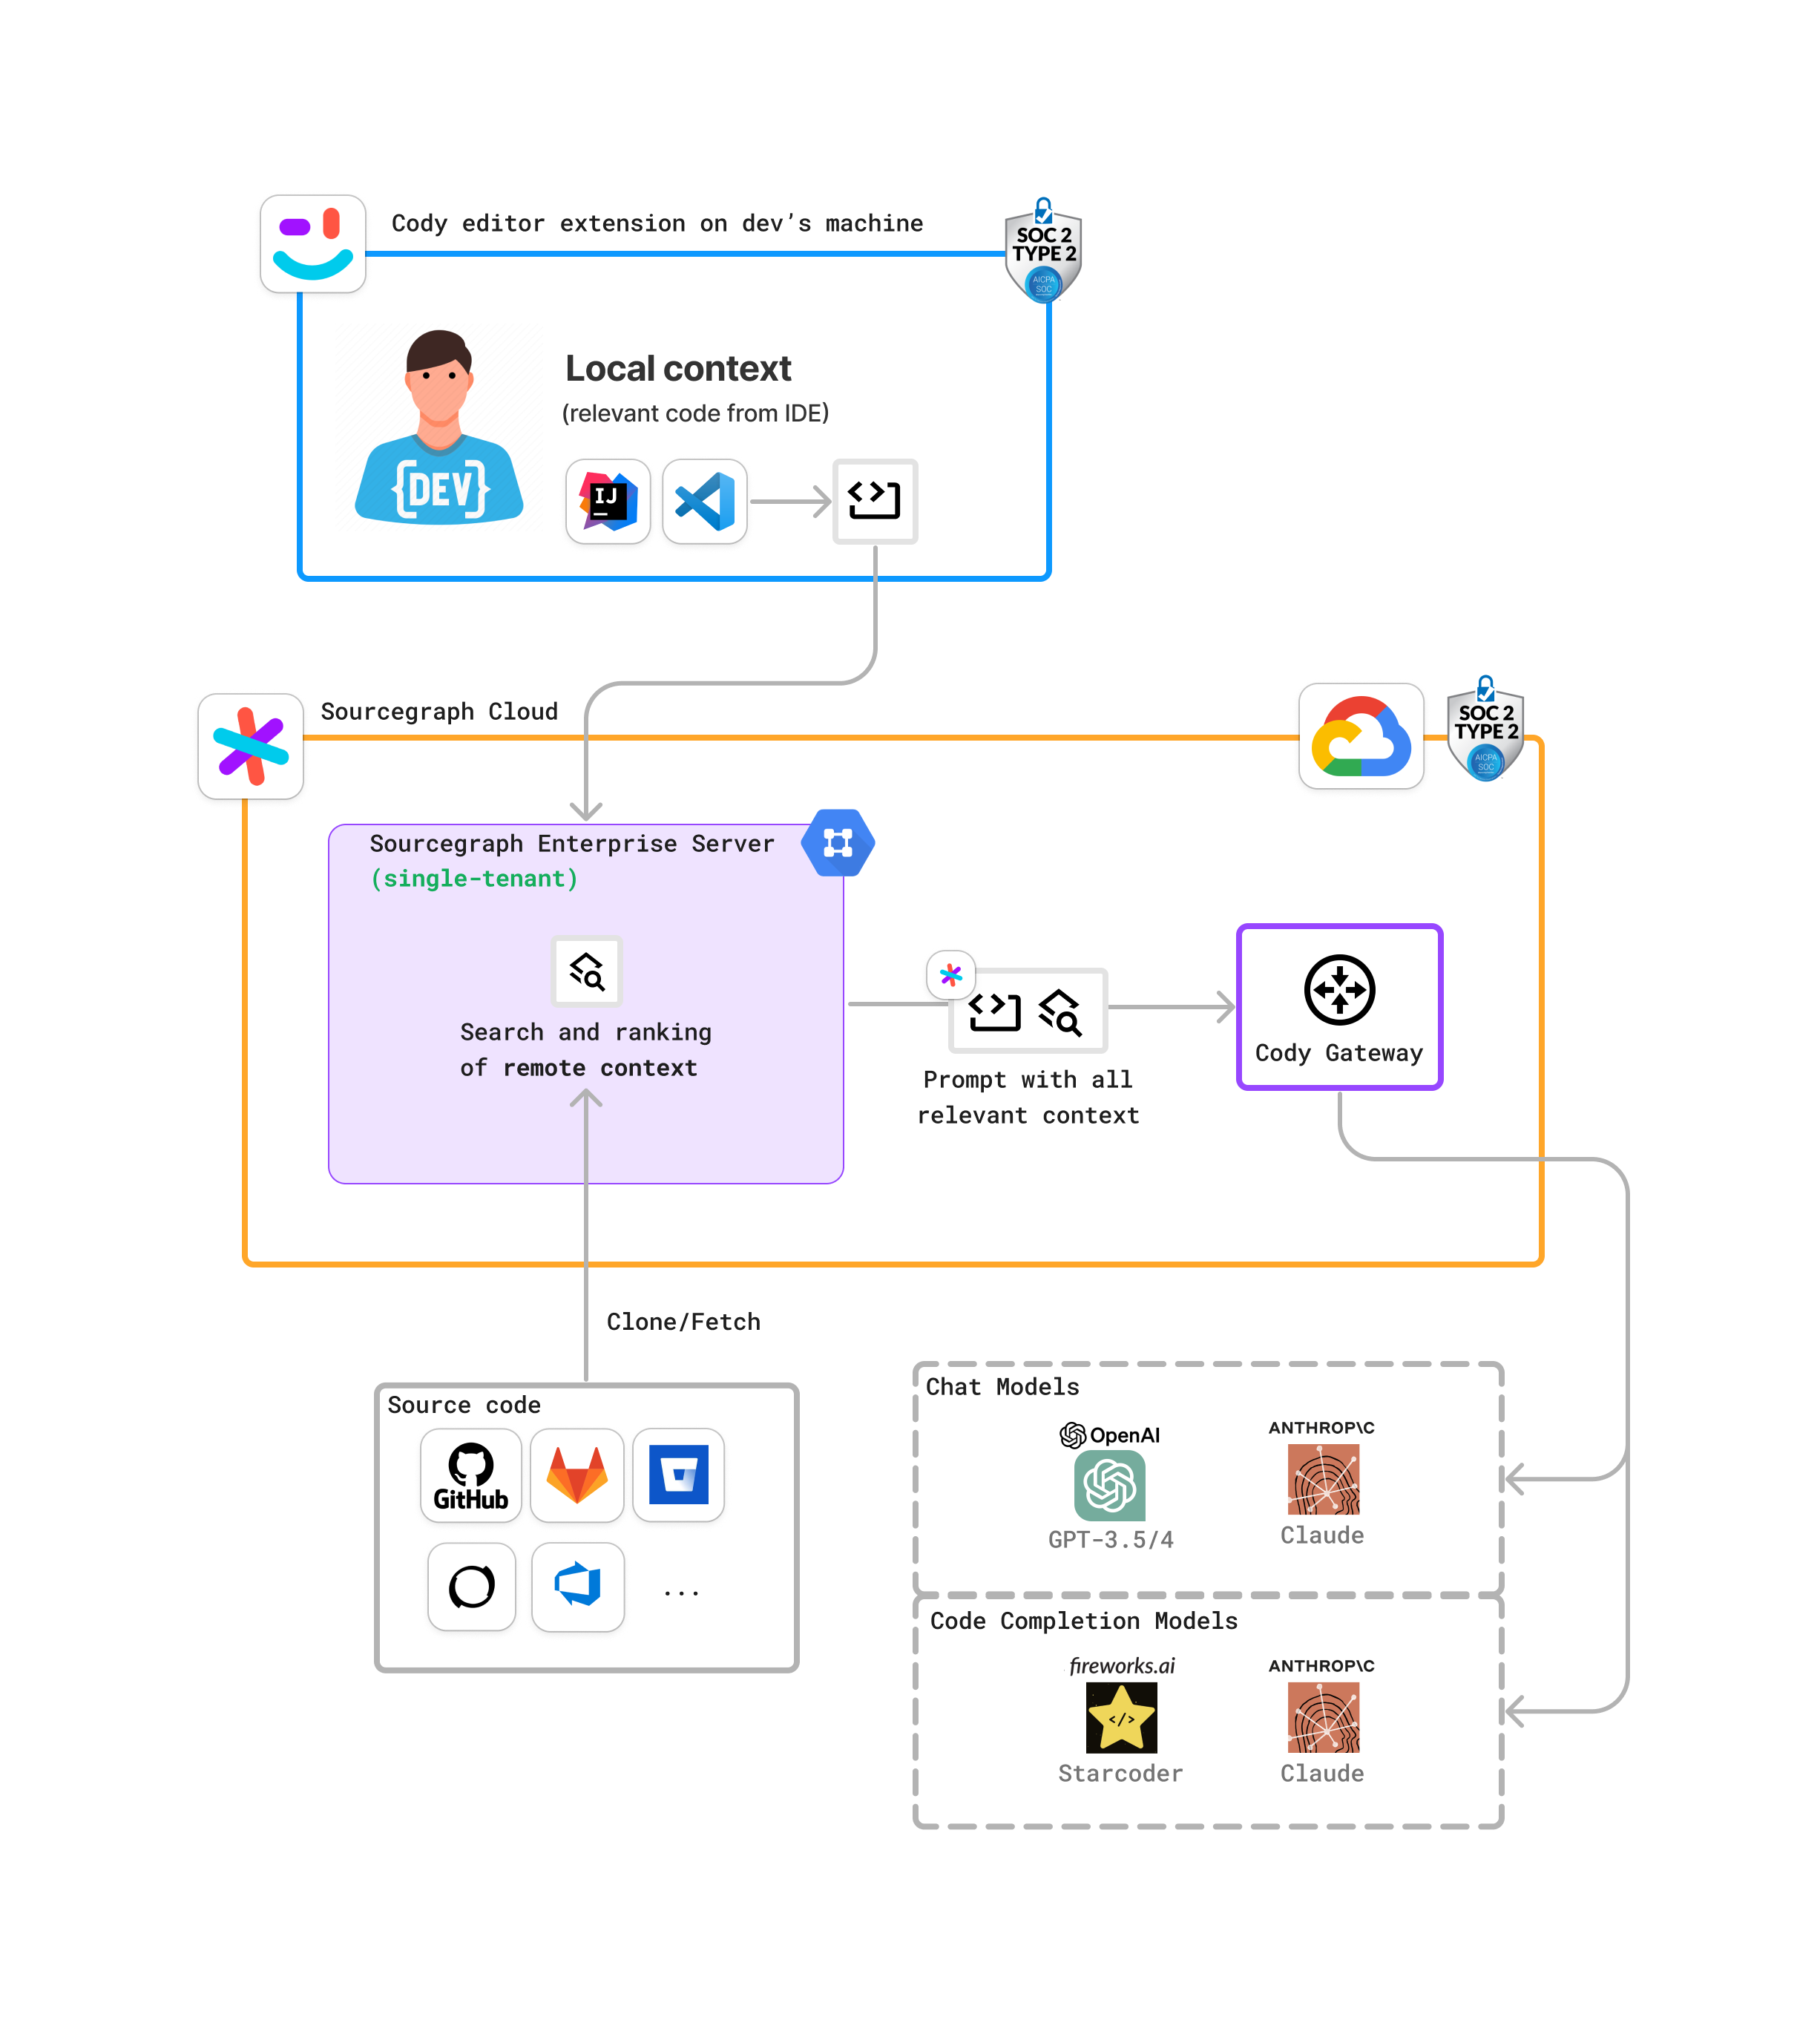
Cody goes beyond keyword matching by understanding code context across your entire repository. This semantic search capability helps developers quickly locate specific functions or variables, even when named differently across files. It integrates directly into VS Code and JetBrains IDEs, providing relevant code snippets and answers to natural language questions about your codebase without leaving your editor.
7. Replit AI pair programmer for cloud debugging
Replit’s AI pair programmer operates entirely within the browser, eliminating local setup friction. This cloud-based environment allows developers to debug code in real-time alongside an AI assistant that understands the entire project structure. It is particularly useful for rapid prototyping and collaborative debugging sessions where immediate execution and feedback loops are critical for identifying logical errors.
8. GitLab Duo AI merge request analysis
GitLab Duo analyzes merge requests by identifying potential bugs, security vulnerabilities, and code quality issues before they reach production. It provides inline suggestions and explanations directly within the merge request interface, helping reviewers understand the impact of changes. This tool streamlines the code review process by highlighting areas that require human attention, reducing the risk of introducing regressions.

9. Raygun AI error tracking and root cause
Raygun uses AI to correlate errors across different services and environments, pinpointing the root cause of complex issues. It groups similar errors and provides contextual information about the code state when the error occurred. This reduces the time developers spend investigating sporadic bugs by offering actionable insights and suggested fixes directly within the error tracking dashboard.
10. Datadog AI-powered log anomaly detection
Datadog’s AI capabilities automatically detect anomalies in log streams, alerting developers to unusual patterns that may indicate system failures. It provides detailed breakdowns of log metrics and suggests potential causes based on historical data. This proactive approach helps teams identify and resolve issues before they impact users, ensuring higher system reliability and faster incident response times.

Pick the right AI debugging tool for your stack
Choosing a debugging tool means matching the software to your daily workflow. An AI assistant that excels at Python might struggle with low-level C++ memory issues. Before buying or subscribing, check two things: language support and IDE integration.
1. Match the language and framework
Not all AI debuggers understand every language equally. Some tools specialize in web development, while others focus on enterprise Java or .NET. If you work primarily in Python, look for tools with deep integration into Jupyter Notebooks or PyCharm. For JavaScript and TypeScript, ensure the AI understands modern frameworks like React or Vue. The best tool is the one that speaks your codebase's language.
2. Check IDE compatibility
An AI debugger is only useful if it lives where you write code. Most developers spend hours in VS Code, IntelliJ, or Visual Studio. Check if the tool offers a native extension for your primary IDE. A tool that requires you to switch windows or copy-paste code into a separate web app will slow you down. Seamless integration keeps your focus on fixing bugs, not managing software.
3. Evaluate AI accuracy and noise
AI tools can sometimes suggest incorrect fixes or highlight non-issues. Look for tools that provide context-aware suggestions rather than generic answers. Read reviews to see if other developers find the AI helpful or distracting. A good tool explains why a bug exists and offers a precise fix, not just a vague tip. Test the free version to see how often its suggestions save you time.


As an Amazon Associate, we may earn from qualifying purchases.
4. Consider team collaboration features
If you work in a team, check if the tool supports shared debugging sessions. Some AI debuggers allow you to record a debugging session and share it with colleagues. This is helpful for onboarding new developers or explaining complex bugs. Look for features like shared snippets, team-wide knowledge bases, and role-based access controls.
5. Review pricing and support
Many AI debugging tools offer a free tier with limited features. Paid plans usually include advanced AI models, priority support, and unlimited usage. Compare the cost against the time you save. If a tool costs $20 a month but saves you two hours of debugging, it’s likely worth it. Check if the vendor offers a money-back guarantee so you can test it risk-free.
No comments yet. Be the first to share your thoughts!