Why AI debugging matters now
Debugging has historically been a manual, iterative process. Developers spent hours stepping through code, hunting for the single line that caused a cascade of failures. Today, AI debugging tools automate the heavy lifting of log analysis and root cause identification. This shift allows engineers to move from searching for errors to implementing solutions, significantly cutting down mean time to resolution.
The volume of code and complexity of modern microservices architectures make traditional manual debugging increasingly unsustainable. AI assistants can parse vast amounts of unstructured data—stack traces, system logs, and user reports—to pinpoint anomalies that human reviewers might miss. They do not just flag issues; they often suggest the exact code correction needed, acting as a pair programmer who has read the entire codebase.
This efficiency gain is critical in 2026, where speed to market and system reliability are competitive advantages. By handling the tedious aspects of error detection, these tools free developers to focus on architecture and feature development. The result is a cleaner, more maintainable codebase with fewer regressions and faster delivery cycles.
10 AI-Powered Debugging Tools in 2026: Fix Bugs Faster
In 2026, precision and speed define effective debugging tools. This roundup features ten specific products that deliver measurable accuracy in identifying and resolving code errors.
1. GitHub Copilot Chat for inline code fixes
GitHub Copilot Chat integrates directly into your editor, allowing developers to highlight buggy code and request immediate fixes. This inline capability reduces context switching, enabling faster resolution of syntax errors and logic flaws. The AI analyzes the surrounding code structure to suggest precise corrections, streamlining the debugging workflow for routine issues without leaving the coding environment.

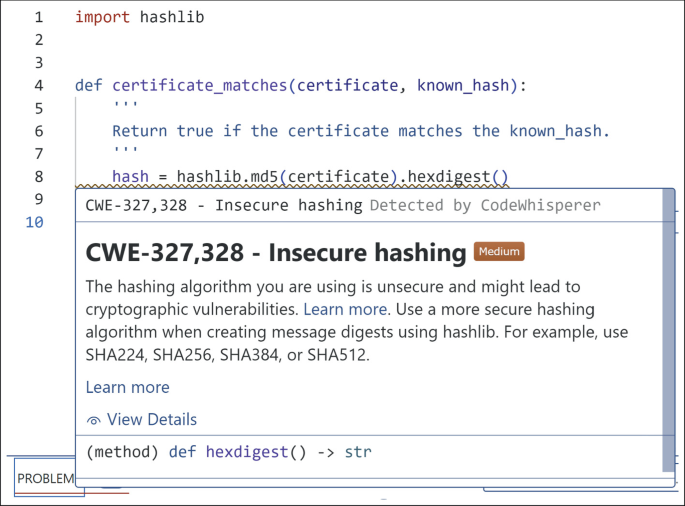
2. Amazon CodeWhisperer security vulnerability scanning
Amazon CodeWhisperer goes beyond syntax by actively scanning code for security vulnerabilities during the debugging process. It identifies potential risks like SQL injection or insecure dependencies in real-time. By flagging these specific security flaws alongside functional bugs, it ensures that debugging sessions address both performance and safety, creating more robust and secure applications from the start.
3. JetBrains IntelliJ IDEA AI debugger assistant
JetBrains IntelliJ IDEA’s AI debugger assistant provides intelligent step-through guidance, predicting likely bug locations based on historical data and code patterns. It helps developers navigate complex execution paths by suggesting relevant breakpoints and highlighting anomalous variable states. This targeted assistance accelerates the identification of root causes in intricate logic flows, saving hours of manual tracing.

4. Visual Studio IntelliCode intelligent code completion
Visual Studio IntelliCode enhances debugging by offering context-aware code completions that anticipate developer intent. This reduces the likelihood of introducing typos or incorrect method calls that lead to runtime errors. By learning from your team’s codebase, it suggests the most probable corrections, minimizing syntax-related bugs and keeping the debugging focus on logical issues rather than trivial mistakes.

5. Sourcegraph Cody semantic code search
Sourcegraph Cody enables semantic code search, allowing developers to find bugs across entire codebases using natural language queries. Instead of keyword matching, it understands the intent behind the code, pinpointing where specific logic errors occur across multiple files. This cross-file debugging capability is invaluable for tracking down issues that stem from interconnected systems or legacy code dependencies.

6. Tabnine AI-powered autocomplete engine
Tabnine operates as a precision autocomplete engine that learns from your specific codebase rather than generic patterns. It suggests entire function bodies and logic blocks instantly, reducing keystrokes and keeping developers in their flow state. This tool excels at context-aware completions that adapt to your team's unique coding standards and library usage.
7. Replit AI pair programmer
Replit transforms the browser into a full-stack development environment where AI acts as an immediate pair programmer. Users can describe complex features in natural language, and the AI generates runnable code across multiple files simultaneously. This integration eliminates context switching between editors and terminals, allowing rapid prototyping and iterative debugging within a single, cohesive workspace.
8. GitLab Duo code review automation
GitLab Duo integrates directly into the merge request workflow to automate routine code review tasks. It highlights potential logic errors, suggests improvements for readability, and flags security anti-patterns before code reaches production. By automating these repetitive checks, teams can focus human reviewer attention on architectural decisions and complex business logic rather than syntax nitpicking.
9. Snyk Code real-time vulnerability detection
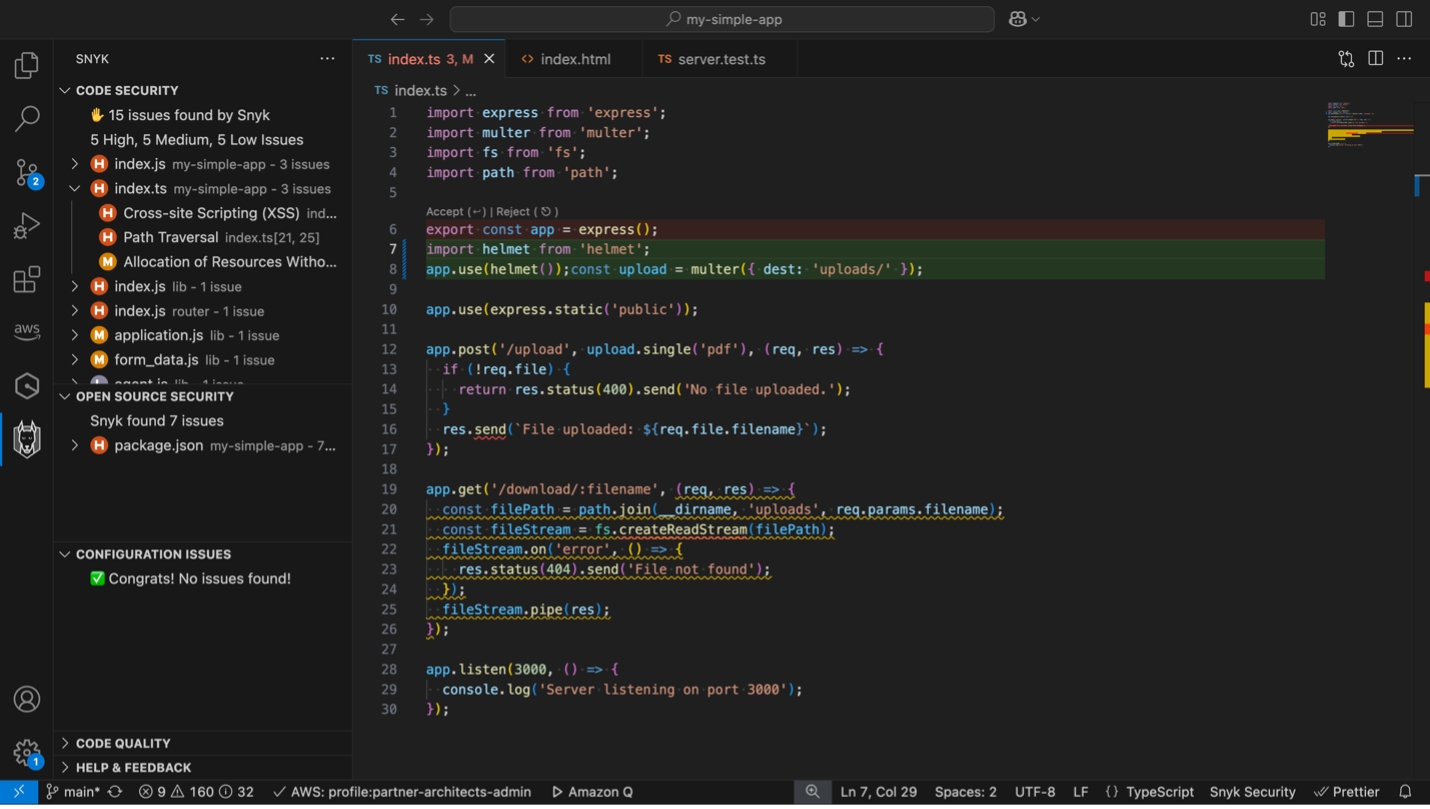
Snyk Code provides real-time vulnerability detection by analyzing code as it is written, not just during CI/CD pipelines. It identifies security flaws like injection attacks and dependency risks immediately, allowing developers to fix issues before they are committed. This proactive approach significantly reduces the attack surface and ensures that security is baked into the development process from the very first line.
10. Datadog AI-powered log analysis
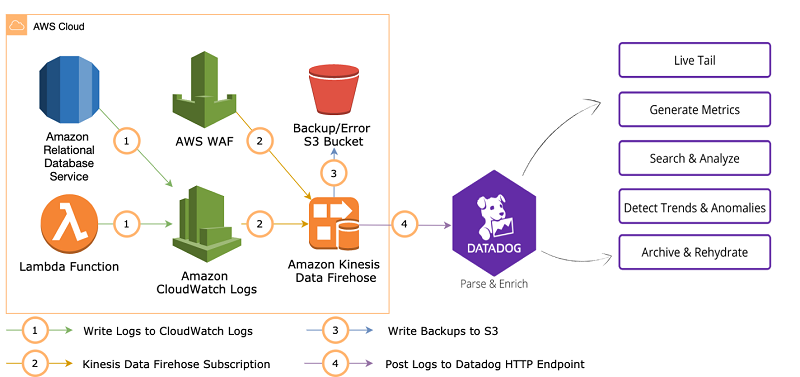
Datadog leverages AI to analyze massive volumes of log data, automatically detecting anomalies and correlating errors across services. Instead of manually searching through thousands of lines, developers receive intelligent alerts that pinpoint the root cause of performance degradation or failures. This capability transforms reactive debugging into proactive monitoring, ensuring system stability and faster resolution times for critical production issues.
How to choose the right debugging tools
Selecting the right debugging tools depends on matching your stack, workflow, and team structure. The three factors that matter most are language support, IDE integration, and team size.
Start by checking language support. If you work primarily in Python, PyCharm Debugger offers deep integration. For web development, Chrome DevTools and Visual Studio Code (VSCode) are industry standards. C++ and system-level work often require specialized tools like WinDbg or GDB.
Next, evaluate IDE integration. Tools that live inside your editor reduce context switching. VSCode extensions and JetBrains plugins provide seamless workflows, while standalone tools like Sentry or New Relic require external dashboards and API integrations.
Finally, consider team size. Solo developers benefit from lightweight, local tools. Larger teams need centralized error tracking and real-time monitoring like New Relic or Sentry to manage distributed issues.
Comparison Table
| Tool | Primary Language | IDE Integration | Best For |
|---|---|---|---|
| PyCharm Debugger | Python | Native | Deep Python debugging |
| Chrome DevTools | JavaScript/Web | Browser | Frontend web issues |
| VSCode | Multi-language | Native | General-purpose development |
| WinDbg | C/C++ | Standalone | System-level debugging |
| Sentry | Multi-language | API/Plugin | Automated error tracking |
Recommended Products


As an Amazon Associate, we may earn from qualifying purchases.
Integrating AI into your existing workflow
Adopting AI debugging tools requires a measured approach to avoid disrupting established CI/CD pipelines or development rhythms. The goal is to enhance accuracy and efficiency without introducing friction into your team's daily routine. Start by identifying the most time-consuming debugging tasks in your current stack and select tools that integrate directly with your existing environment.
Select a single, isolated service or a non-critical microservice for your initial test. This allows your team to evaluate how AI-powered suggestions perform in a realistic but low-risk setting. Observe how tools like Sentry or Instabug integrate with your error tracking without impacting production stability.

Integrate the AI debugging tool into your build process to automate root cause analysis. Configure the tool to run during specific stages, such as after unit tests or before deployment. This ensures that potential issues are flagged early in the development cycle, reducing the load on senior developers.
Ensure the selected tool offers a seamless experience within your primary IDE, such as Visual Studio Code or JetBrains IDEs. Developers should be able to trigger AI-assisted debugging directly from their editor without switching contexts. This reduces cognitive load and keeps the focus on fixing the bug rather than managing the tool.

Establish a feedback loop where developers rate the accuracy of AI suggestions. Use this data to tune the tool's parameters or filter out false positives. Regular reviews ensure that the AI debugging tools remain relevant and accurate as your codebase evolves, maintaining high standards for code quality.
By following these steps, you can gradually introduce AI capabilities into your workflow. This methodical integration ensures that your team benefits from faster debugging cycles while maintaining control over your development processes.
Common debugging questions answered
Developers often worry about data privacy and accuracy when integrating AI into their workflows. Tools like Sentry and New Relic operate on established cloud infrastructures, but you should review their specific data retention policies to ensure sensitive code snippets aren’t permanently stored. Always anonymize stack traces before uploading them to external debugging services.
Regarding accuracy, AI-powered debugging tools like IntelliJ IDEA and VS Code rely on pattern matching rather than true reasoning. They suggest fixes based on historical codebases, which means they can occasionally propose solutions that introduce new bugs. Treat AI suggestions as starting points for review, not final answers.
Cost is another practical concern. Many advanced debugging tools offer free tiers for individual developers, such as PyCharm Community Edition or basic Chrome DevTools features. Enterprise-grade solutions like ReSharper or Xcode subscriptions scale with team size, so evaluate whether the automation savings justify the license fees for your specific project scope.

No comments yet. Be the first to share your thoughts!