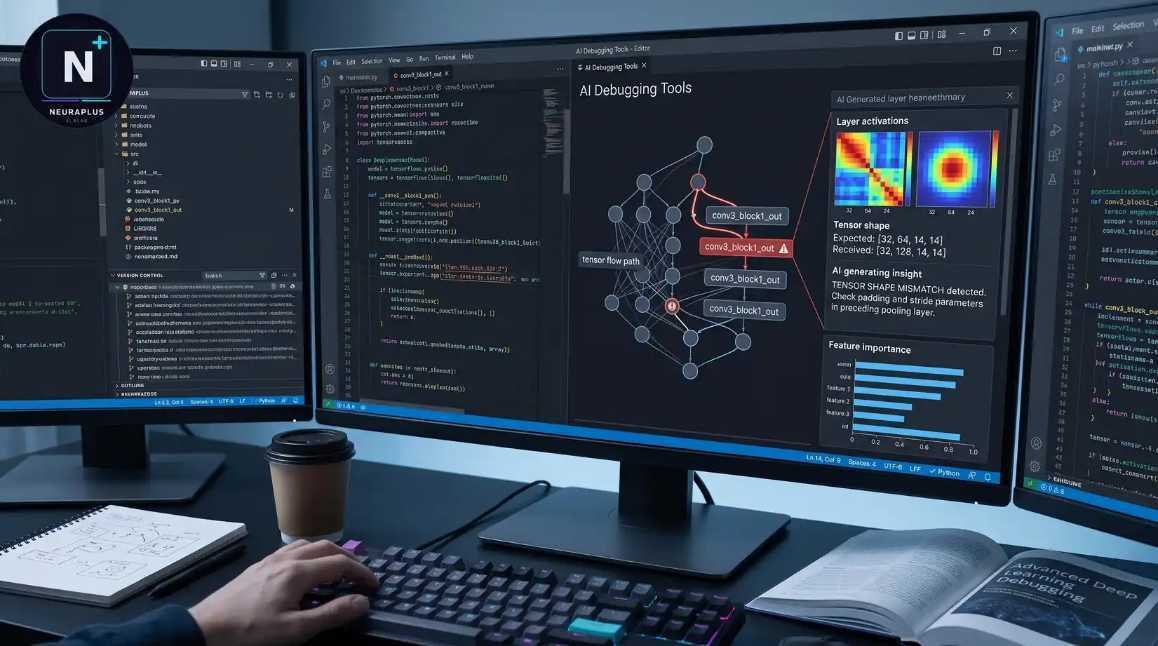
Why AI changes debugging workflows
Debugging has always been a detective story. You chase a symptom, follow a trail of logs, and hope you find the root cause before the deployment window closes. For decades, that process relied on human intuition and manual stepping through code. AI shifts this dynamic by moving from reactive tracing to proactive pattern recognition.
Instead of waiting for a crash to analyze a dump file, AI-powered debugging tools scan your codebase for anomalies in real time. They compare your current structure against millions of known patterns, identifying potential failures before they reach production. This changes the developer's role from firefighter to architect, focusing effort on system design rather than symptom management.
Consider the difference between using a traditional CLI debugger like GDB or WinDbg and an AI assistant. With GDB, you set breakpoints and step line-by-line, manually inspecting memory states. It is precise but slow. An AI tool, by contrast, ingests the entire context of your error logs and stack traces. It suggests the likely offending function and often provides the corrected code snippet immediately.
This shift accelerates the feedback loop. Developers spend less time searching for "needle in a haystack" bugs and more time building features. The tools don't just find errors; they explain why the code failed, bridging the gap between raw data and actionable insight.
5 Best AI Debugging Tools for 2026
Debugging complex codebases in 2026 demands more than just intuition; it requires AI-powered tools that can pinpoint errors before they hit production. We’ve evaluated the top contenders to help you find the right debugging assistant for your workflow.
1. Amazon CodeWhisperer real-time suggestions
Amazon CodeWhisperer acts like a tireless pair programmer that watches your keystrokes and offers context-aware code completions instantly. It scans your current file and project structure to suggest relevant snippets, helping you write boilerplate faster while keeping security in mind by scanning for vulnerabilities in the generated code.
2. GitHub Copilot Chat context awareness
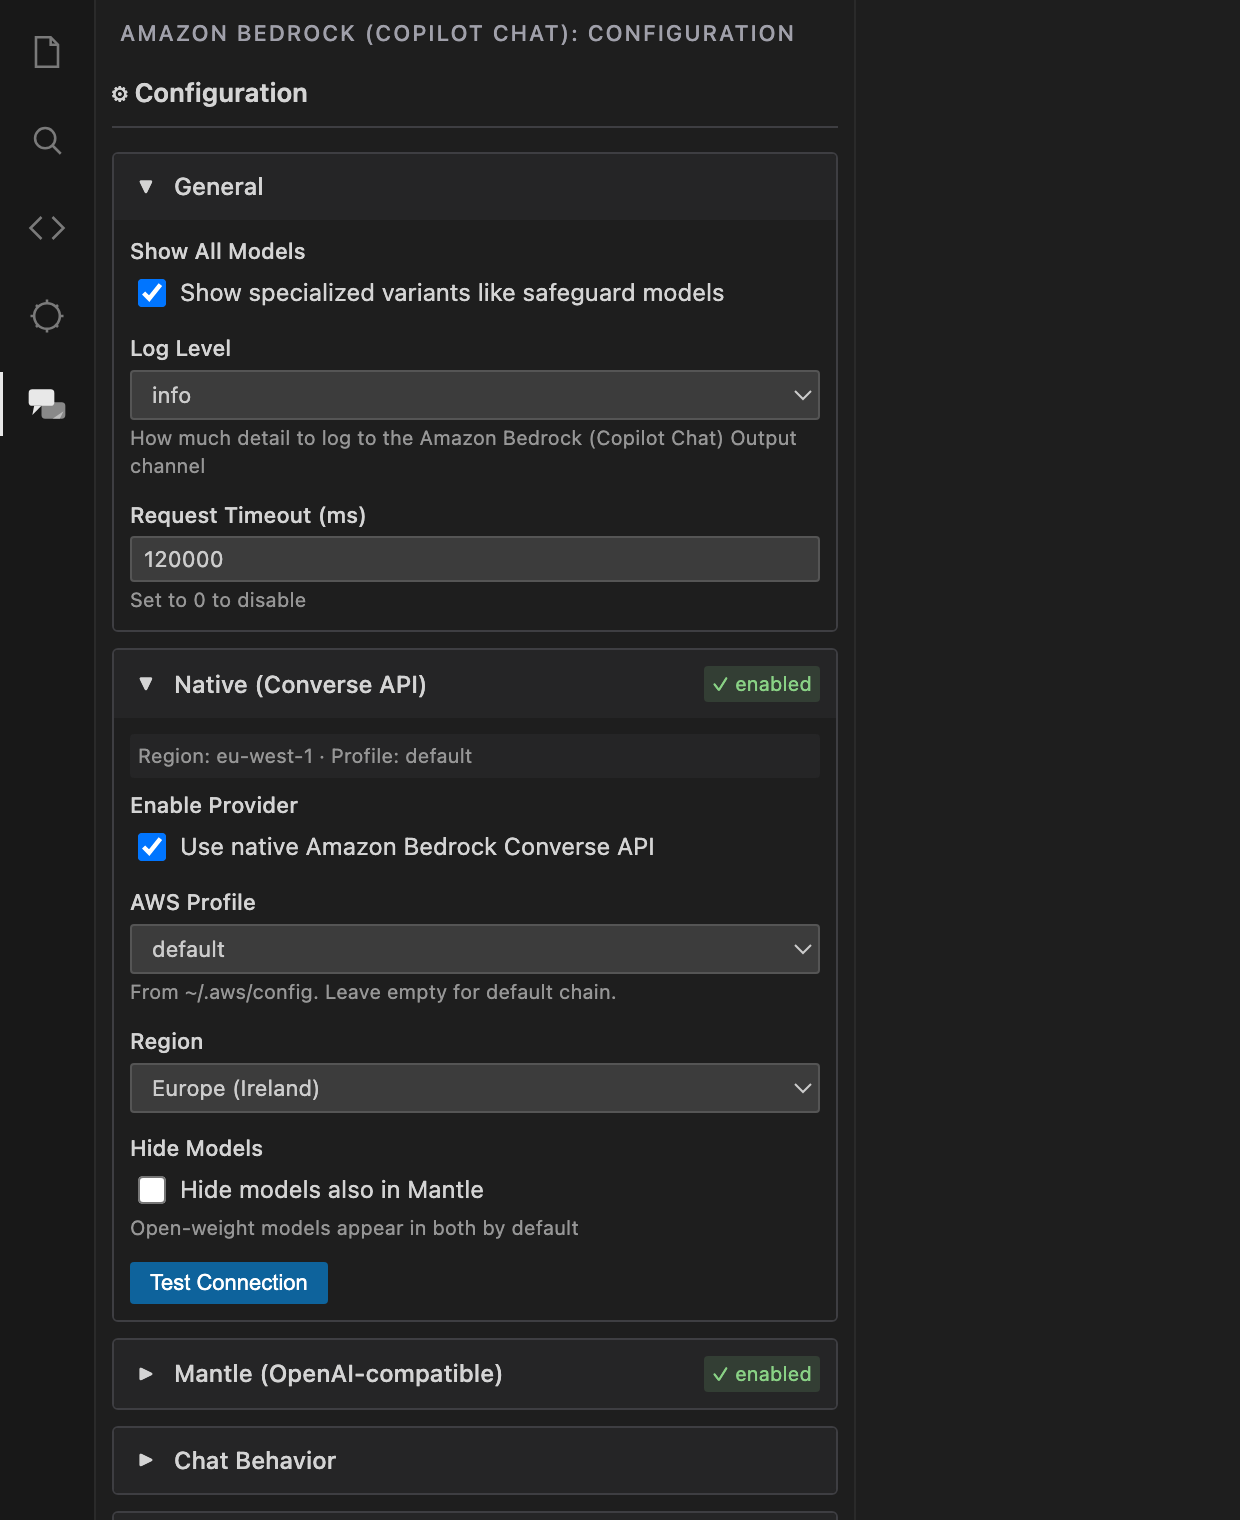
GitHub Copilot Chat transforms debugging by allowing you to ask natural language questions about your entire codebase. It understands the context of your open files and repository structure, enabling you to pinpoint errors or request explanations for complex logic without manually searching through documentation or stack traces.
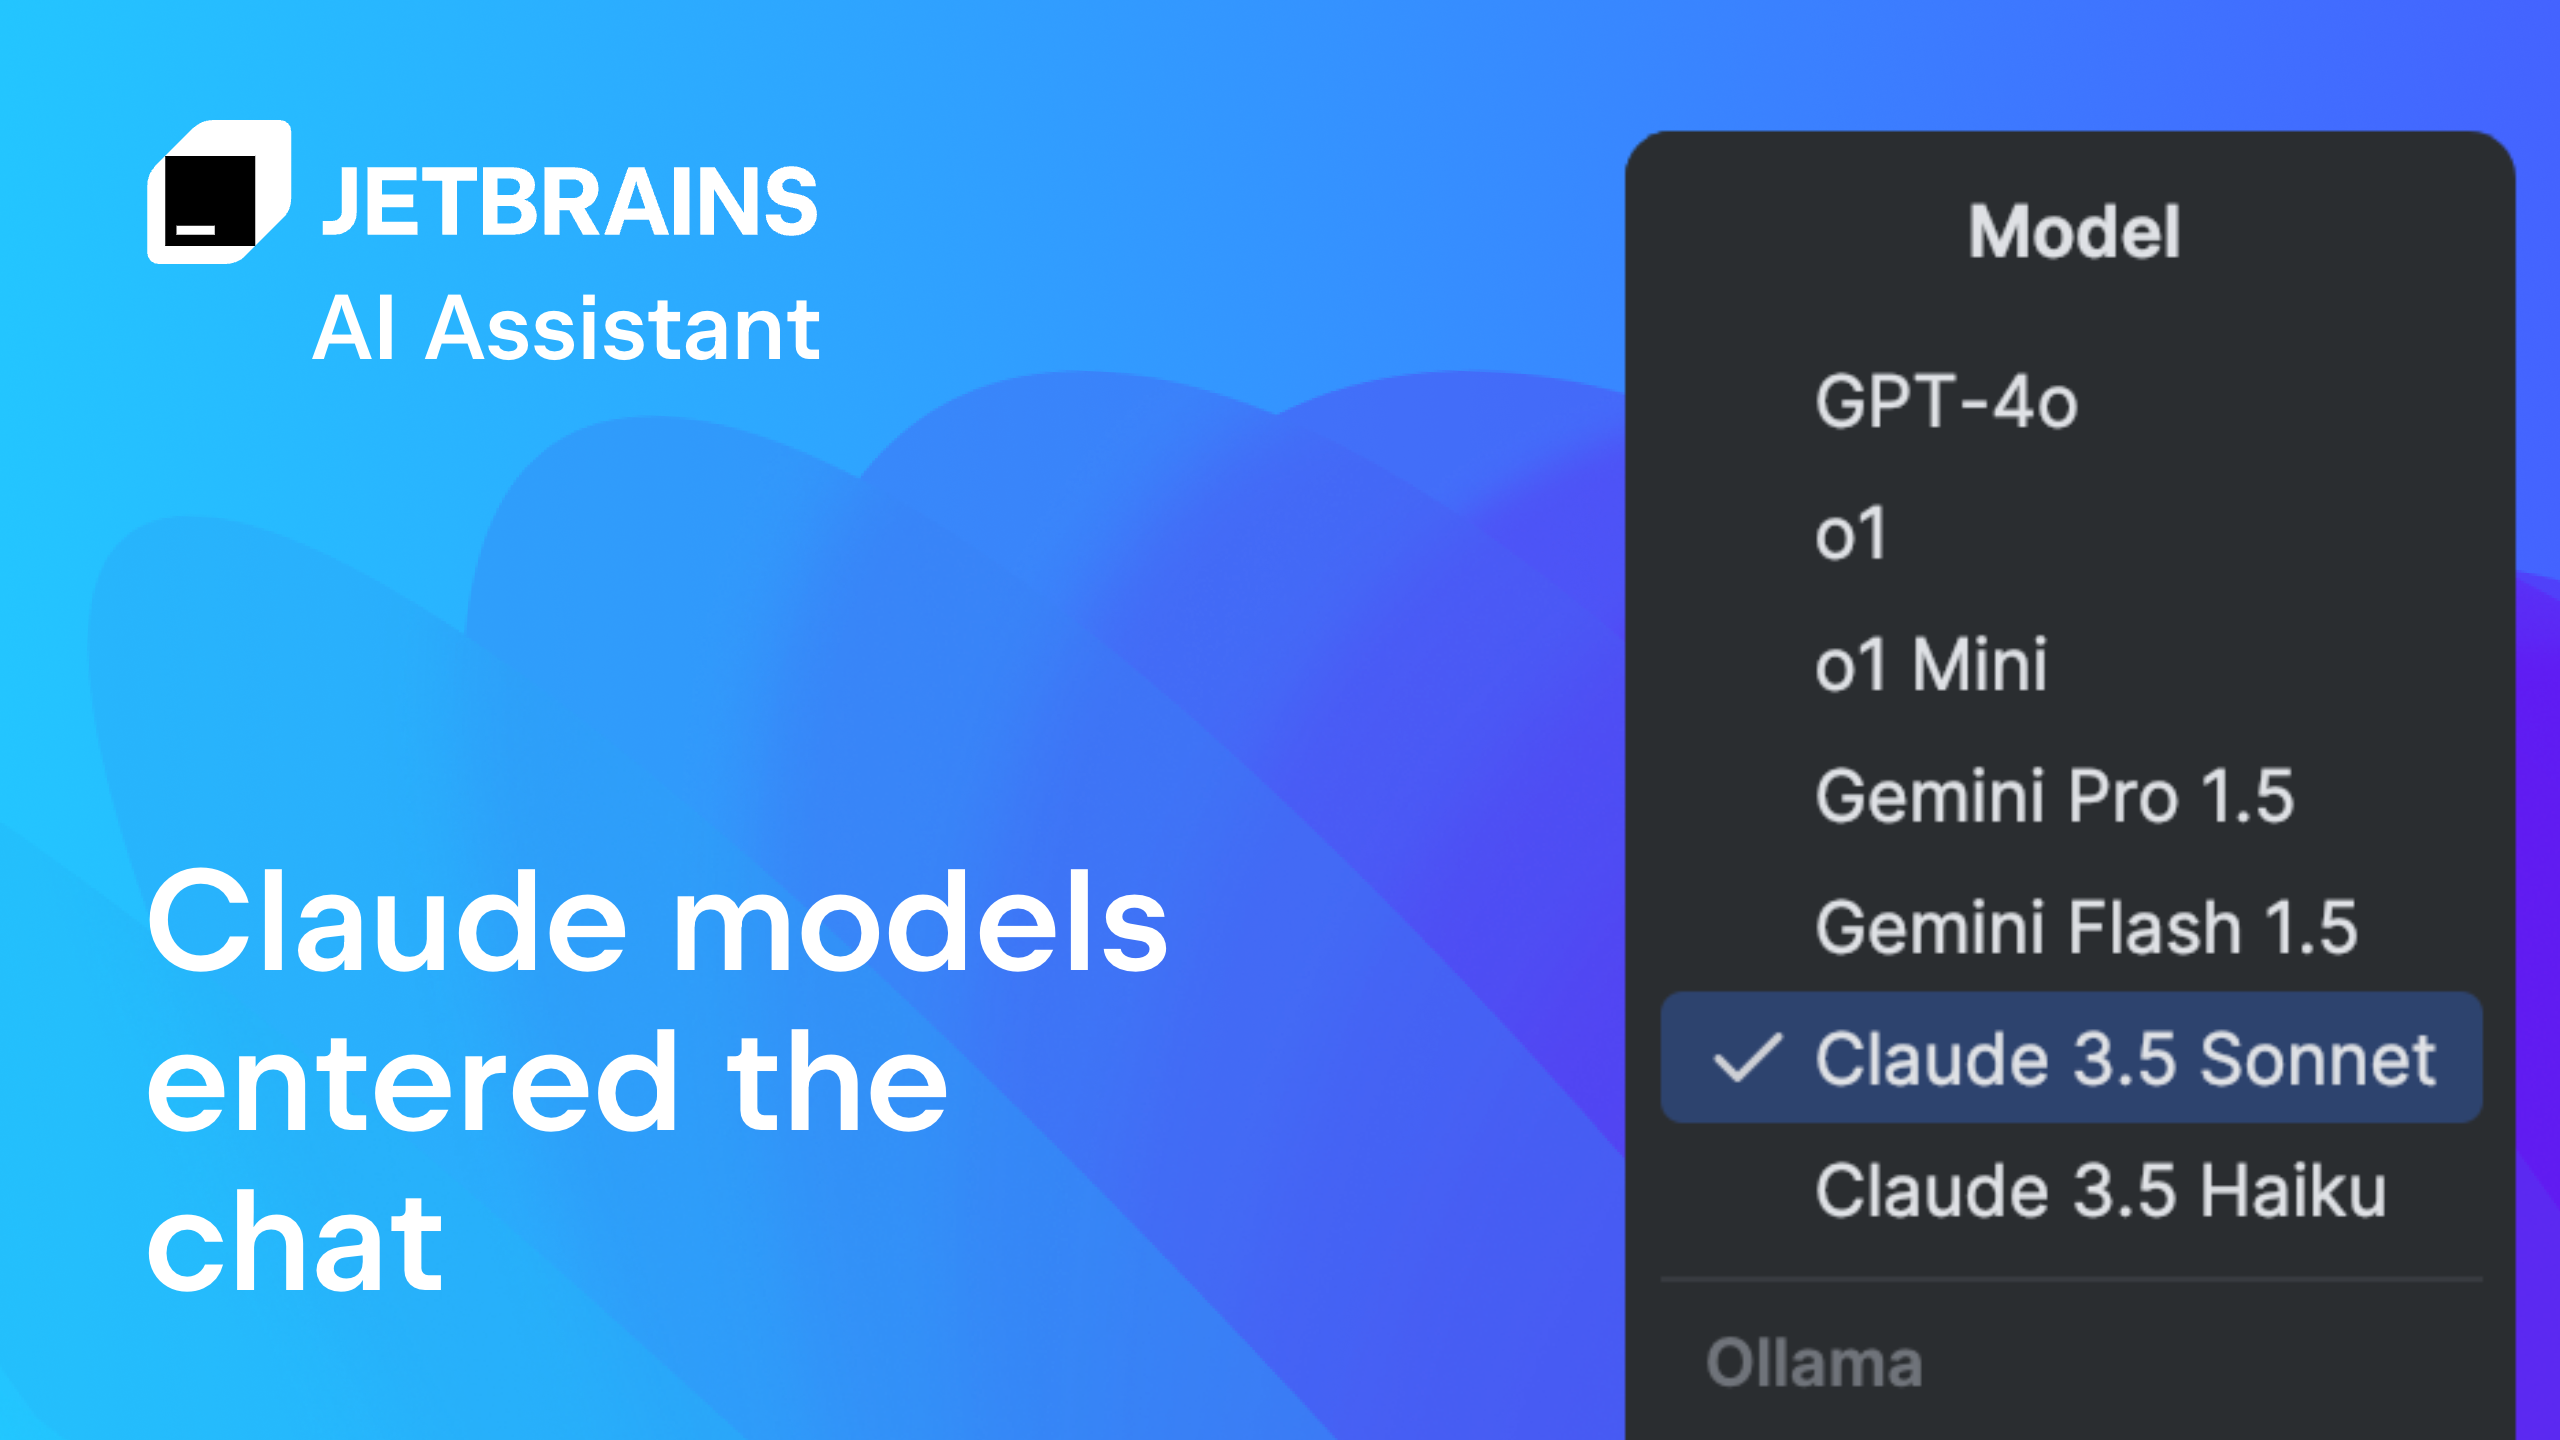
3. JetBrains AI Assistant IDE integration
The JetBrains AI Assistant is deeply woven into the IntelliJ, PyCharm, and other JetBrains IDEs, offering debugging help without leaving your workflow. It provides inline explanations, test generation, and refactoring suggestions that respect the specific nuances of the JetBrains ecosystem, making it a seamless companion for complex projects.
4. Replit AI pair programmer features
Replit’s AI pair programmer operates within a cloud-based environment, allowing for instant debugging and collaboration regardless of local setup. It helps you identify logic errors and suggests fixes in real-time, making it ideal for rapid prototyping or teams working together on shared codebases without configuration headaches.
5. Tabnine custom model training options
Tabnine stands out by allowing organizations to train custom AI models on their proprietary codebases, ensuring suggestions align with internal standards and best practices. This level of customization makes it a powerful tool for debugging within specific enterprise contexts, where generic models might miss nuanced internal patterns or security protocols.
How to compare AI debugging features
Choosing the right AI debugging tool isn't just about price; it's about how well the software fits into your existing workflow. You need to weigh three main factors: how deeply it integrates with your IDE, how accurately it identifies root causes, and which programming languages it actually supports.
A tool that only works in one editor limits your flexibility. For example, while VS Code is a popular choice for many developers, its AI plugins might not play nice with JetBrains IDEs like PyCharm or IntelliJ. Similarly, accuracy matters more than speed. A tool that quickly gives you a wrong fix is more frustrating than one that takes a few extra seconds to provide a precise solution.
To help you decide, we've broken down the key capabilities of the top contenders. This comparison focuses on practical usability rather than marketing fluff.
| Tool | IDE Integration | Key Languages | AI Accuracy |
|---|---|---|---|
| Amazon Q Developer | VS Code, JetBrains, CLI | Python, Java, JavaScript, C++ | High (context-aware) |
| GitHub Copilot | VS Code, Neovim, JetBrains | Python, JavaScript, TypeScript, Go | High (pattern-based) |
| Tabnine | VS Code, IntelliJ, Vim | Python, Java, C#, PHP | Medium-High (on-prem option) |
| Codeium | VS Code, JetBrains, Vim | Python, Java, C++, Go | High (fast inference) |
| Replit AI | Replit IDE only | Python, JavaScript, HTML/CSS | Medium (sandbox-focused) |


As an Amazon Associate, we may earn from qualifying purchases.
Integrating AI into your debug workflow
Adding AI debugging tools to your daily routine doesn't require a complete overhaul of your existing processes. Think of these tools as co-pilots that handle the heavy lifting of pattern recognition, allowing you to focus on architectural logic and complex problem-solving.
Start with a single integration point
Pick one high-friction area in your current workflow, such as analyzing error logs or reviewing complex code snippets. Integrate an AI debugging assistant into that specific context first. For example, enable inline suggestions in your editor like VS Code or PyCharm to get immediate feedback without leaving your coding environment.
Establish clear input and output standards
AI tools perform best when given structured context. Define how you will share code snippets, error messages, and reproduction steps with the AI. Create a simple checklist for your team to ensure consistent inputs, which leads to more accurate and actionable debugging suggestions.
Review and refine suggestions critically
Never blindly accept AI-generated fixes. Treat every suggestion as a draft that requires your expert review. Validate the logic, check for side effects, and ensure the solution aligns with your project's best practices. This iterative review process builds trust in the tool while maintaining code quality.
Scale gradually across the team
Once the initial integration proves successful, expand the tool's usage to other team members and projects. Share best practices, common pitfalls, and effective prompting strategies. Gradual scaling ensures that the entire team benefits from the efficiency gains without disrupting ongoing development cycles.
Monitor impact and adjust
Track key metrics such as mean time to resolution (MTTR) and bug recurrence rates. Use this data to refine your integration strategy and identify areas where additional training or tool adjustments are needed. Continuous monitoring ensures that the AI debugging tool remains a valuable asset to your workflow.
Common questions about AI debugging
Do AI debugging tools actually find real bugs? Not always. AI tools excel at spotting syntax errors and obvious logic flaws, but they can miss subtle race conditions or architectural issues. Treat them as a first line of defense, not a replacement for manual code review or unit tests.
Is it safe to let AI tools scan my codebase? Security depends on the tool’s data policy. Reputable platforms like GitHub Copilot or Cursor encrypt data in transit and typically do not use your code to train public models. Always check the provider’s privacy policy before connecting sensitive repositories.
Are these tools expensive for small teams? Many AI debugging assistants offer free tiers or generous trial periods. For example, basic linting and syntax checking are often free, while advanced AI-driven root cause analysis usually requires a subscription. Start with the free features to see if they fit your workflow before committing to a paid plan.

No comments yet. Be the first to share your thoughts!