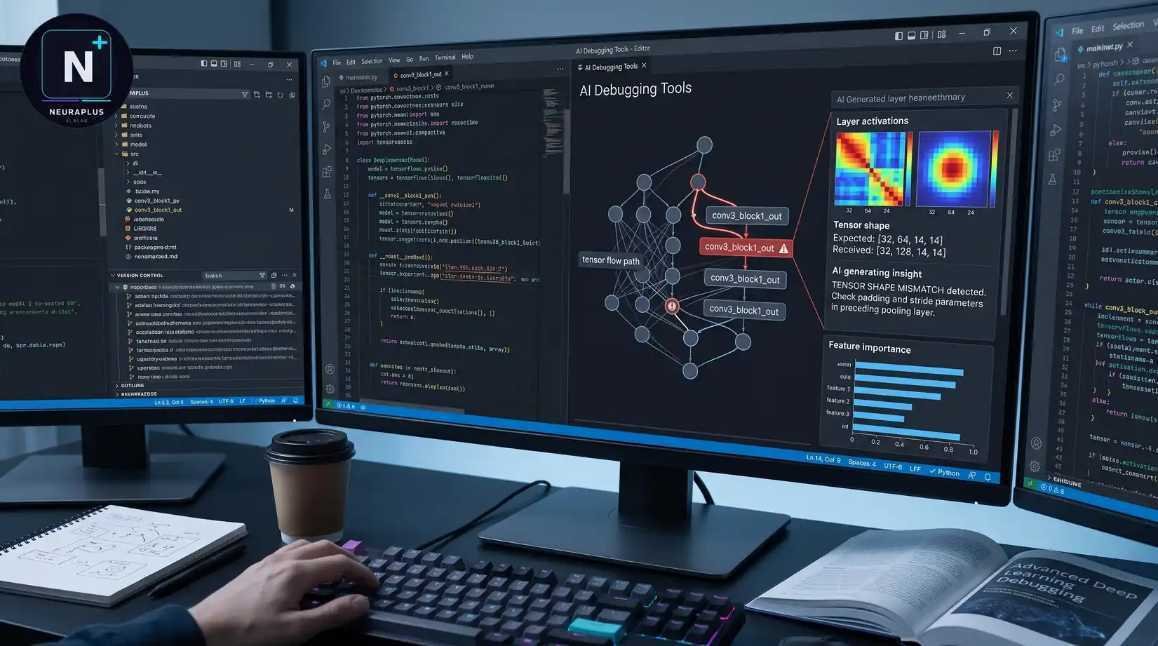
Why AI debugging matters now
Debugging has historically been a manual, linear process. Developers traditionally relied on stepping through code line-by-line using tools like GDB or LLDB, setting breakpoints to inspect variable states one at a time. While these traditional debuggers are powerful for understanding execution flow, they require the developer to already know where the problem likely lies. This approach is effective for simple syntax errors but becomes a bottleneck when hunting for complex, non-deterministic bugs in large codebases.
AI-augmented IDEs and debugging tools represent a shift from reactive stepping to proactive root cause analysis. Instead of waiting for a crash log or manually tracing a stack trace, AI tools analyze the entire context of your code, dependencies, and error messages to suggest the likely source of the issue. They act as a pair programmer that can instantly highlight anomalies, reducing the time spent on "detective work" and allowing developers to focus on fixing the root cause rather than finding it.
This transition is critical because modern software development moves faster than manual review cycles can support. By automating the initial triage of errors, AI debugging tools significantly cut down the time between encountering a bug and resolving it. This efficiency gain is particularly valuable in continuous integration environments where rapid feedback loops are essential for maintaining code quality and velocity.
5 AI-Powered Debugging Tools That Cut Code Review Time
Code review bottlenecks often stem from manual error detection, but integrating specialized debugging tools can automate this process and accelerate delivery cycles. These five AI-powered solutions are selected for their ability to identify logic flaws and syntax errors in real-time, reducing the cognitive load on developers.
-
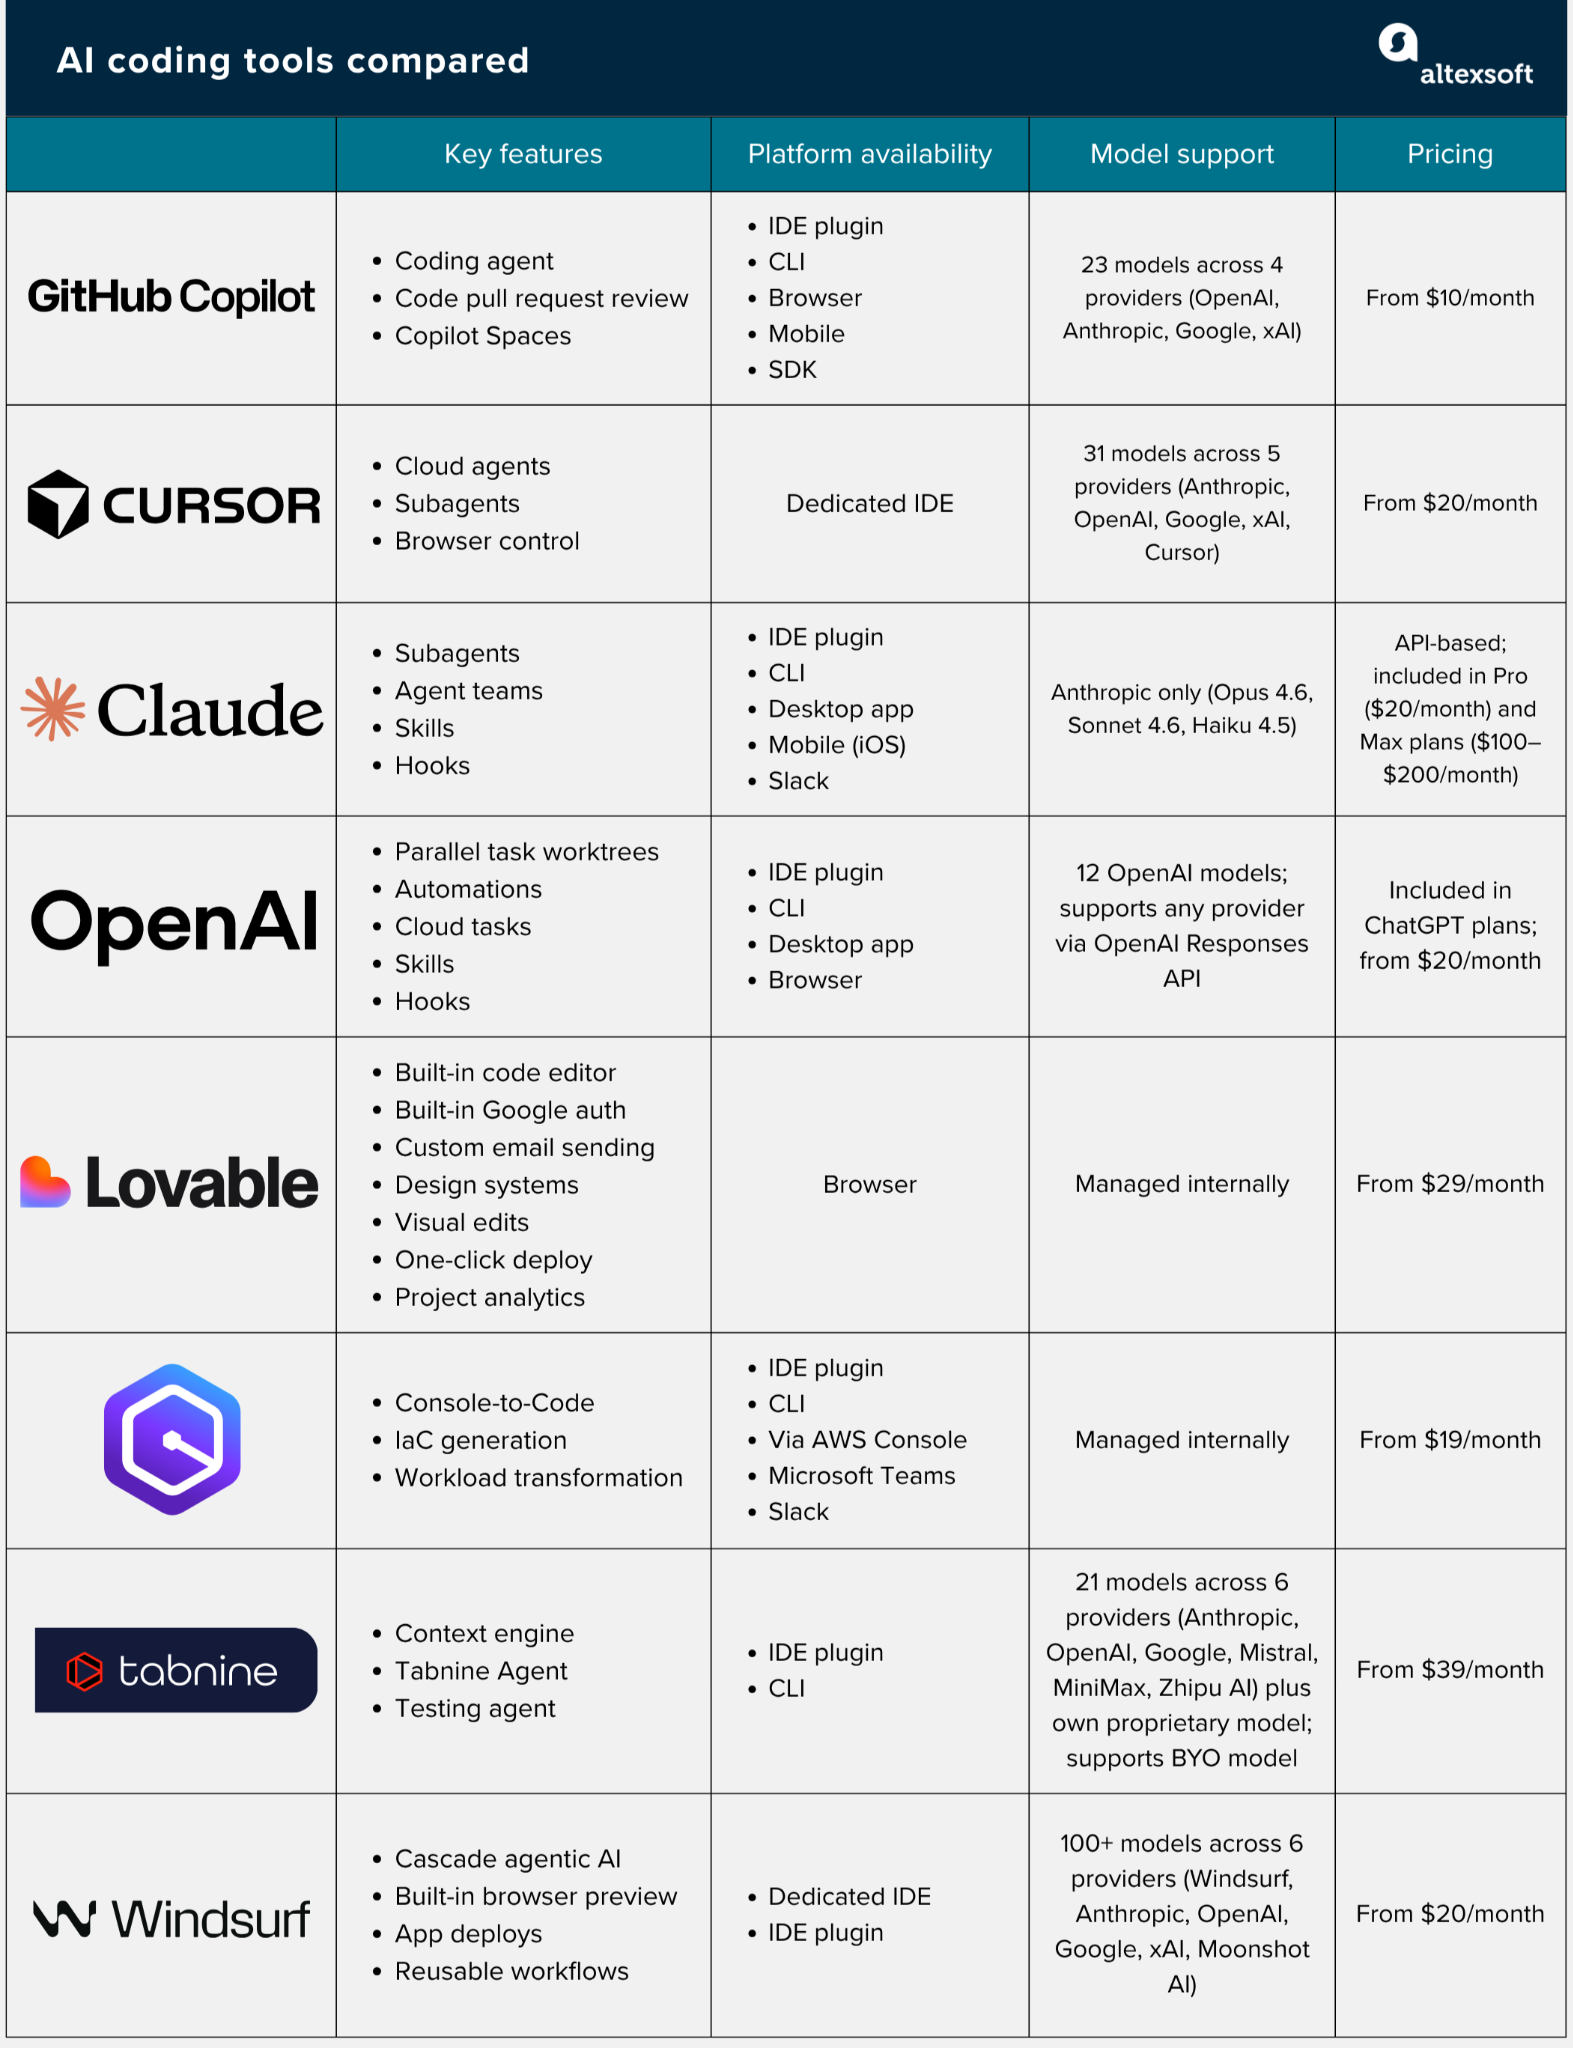
GitHub Copilot Chat
GitHub Copilot Chat integrates directly into your IDE, allowing developers to ask natural language questions about their codebase. It excels at explaining complex logic or suggesting fixes for specific errors without leaving the editor. This contextual awareness speeds up debugging by providing immediate, relevant explanations for stack traces or unexpected behavior, making it a staple for rapid issue resolution. -
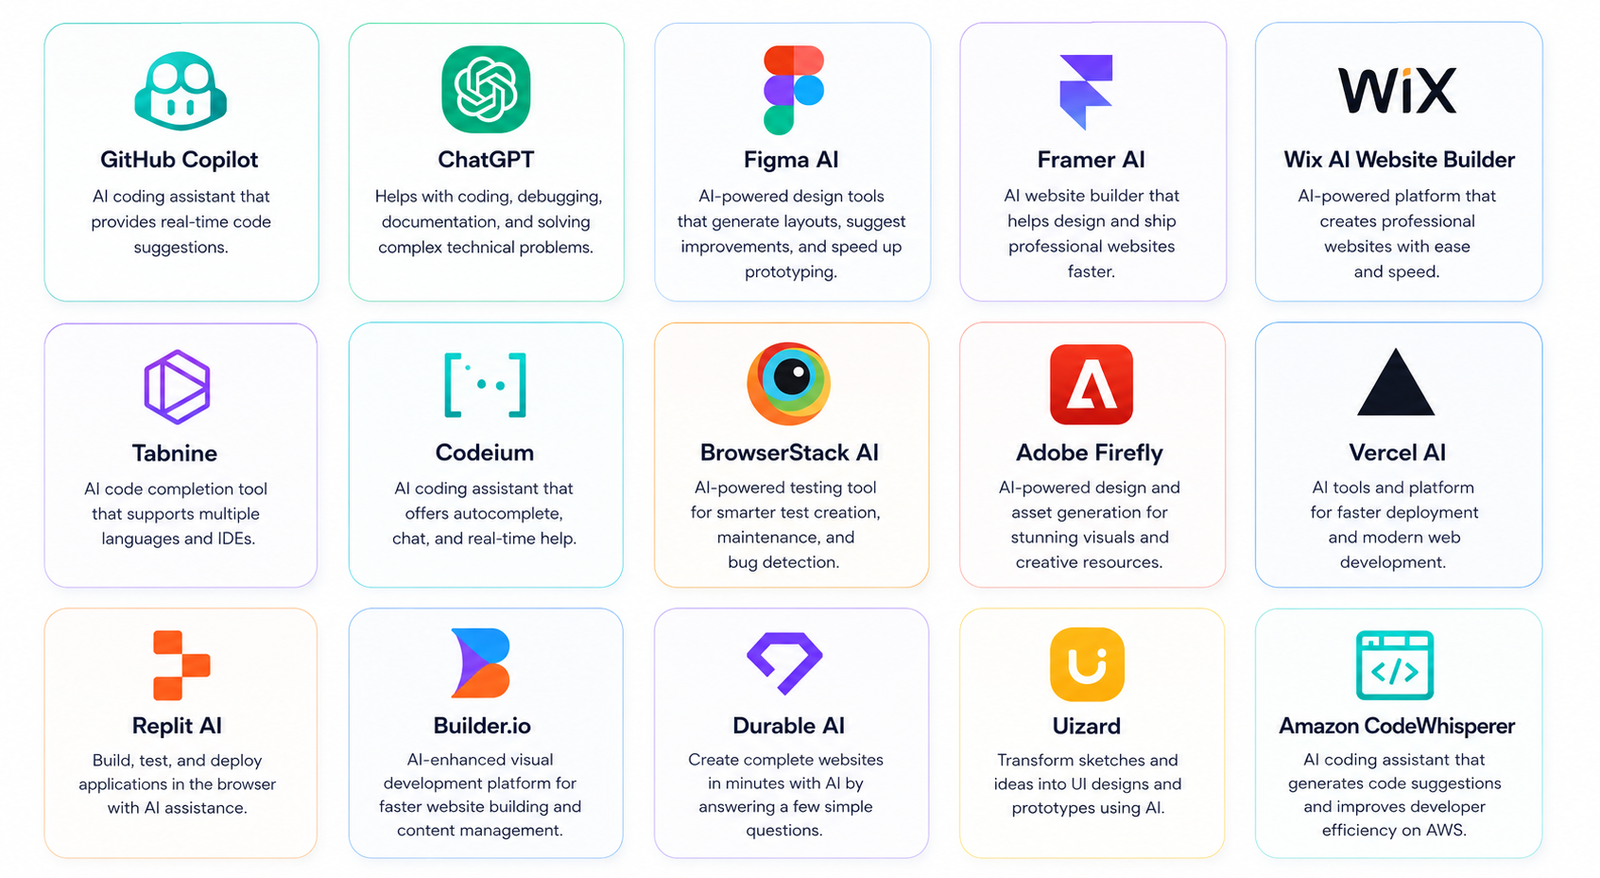
Amazon CodeWhisperer
Amazon CodeWhisperer offers real-time security scans alongside code suggestions, identifying potential vulnerabilities as you type. This proactive approach helps developers catch security flaws before they become debugging nightmares. By integrating seamlessly with AWS services, it provides context-aware recommendations that align with cloud best practices, ensuring that debugging efforts focus on functional logic rather than basic security hygiene. -
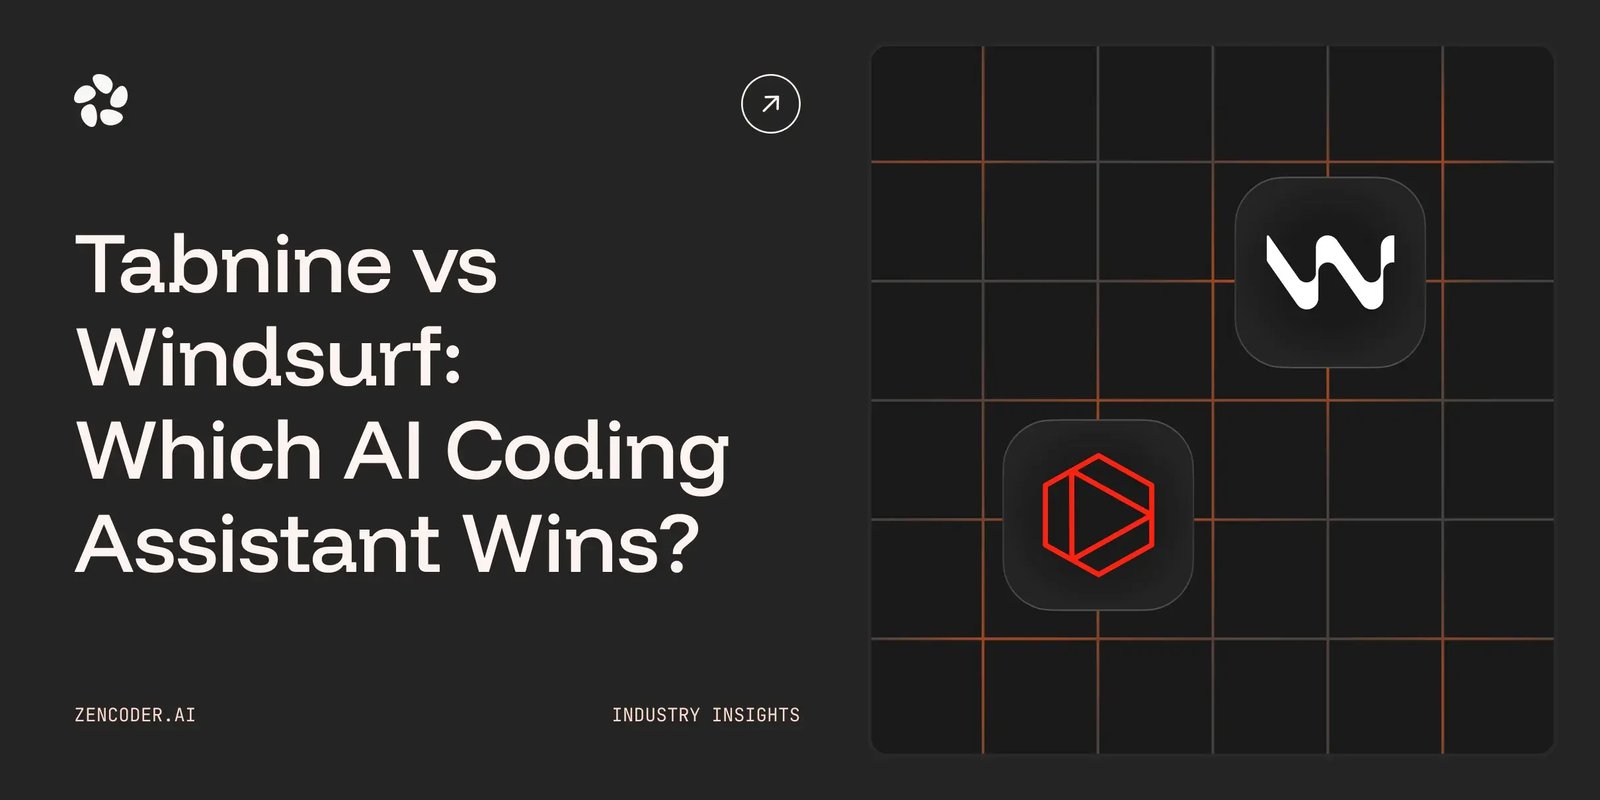
Tabnine AI Assistant
Tabnine AI Assistant prioritizes privacy by offering on-premises deployment options for enterprise codebases. It learns from your team’s specific coding patterns to provide highly personalized suggestions. This customization reduces the noise of generic AI outputs, allowing developers to focus on debugging unique architectural issues. Its ability to understand local context makes it particularly effective for teams with strict data governance requirements. -
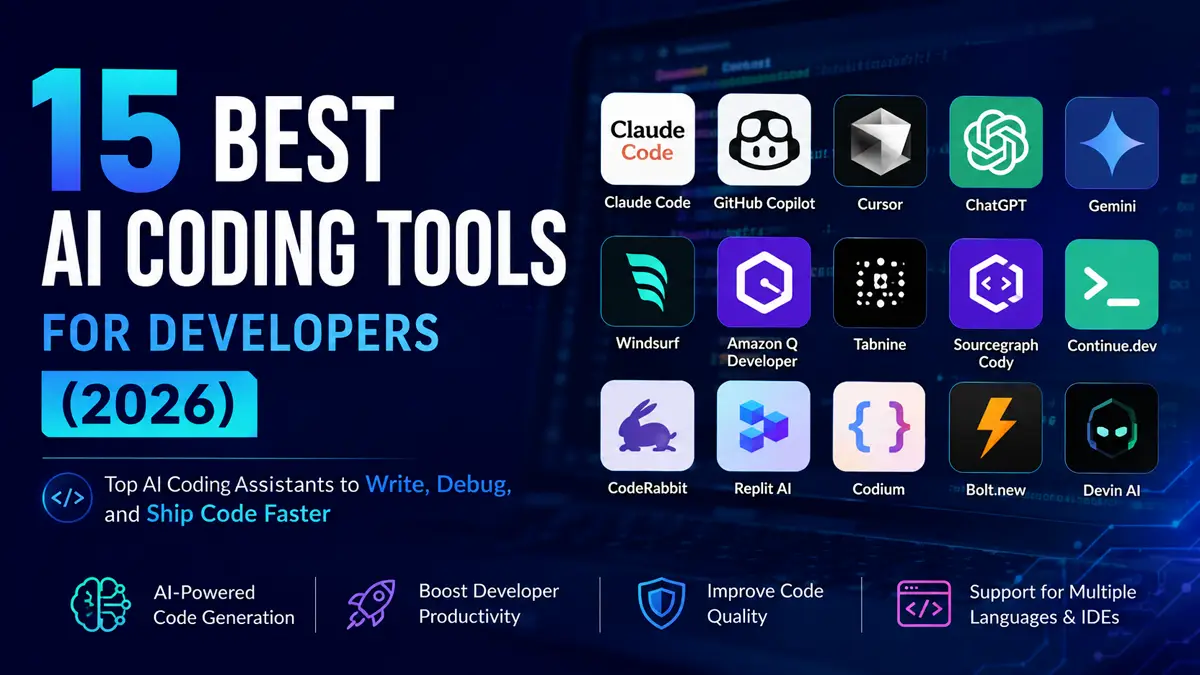
Sourcegraph Cody
Sourcegraph Cody leverages deep codebase indexing to answer questions across your entire repository. It understands the relationships between disparate files, making it invaluable for debugging issues that span multiple modules. By providing precise references to where functions are defined and used, it eliminates the need for manual searching, significantly accelerating the root cause analysis phase of the debugging process. -
JetBrains AI Assistant
The JetBrains AI Assistant is tightly integrated into the IntelliJ ecosystem, offering context-aware suggestions within the IDE’s native interface. It understands the specific nuances of JetBrains’ code analysis tools, providing debugging advice that aligns with the platform’s existing features. This seamless integration allows developers to quickly generate test cases or refactor code, reducing the friction between writing and verifying logic.
How AI Changes Bug Tracking Workflows
The introduction of AI into debugging tools shifts the operational model from reactive firefighting to proactive prevention. Instead of waiting for a user to report a crash, modern platforms like Instabug and New Relic capture context before the session ends, automatically generating structured tickets with root cause analysis. This reduces the noise in your issue tracker and allows developers to prioritize fixes based on severity rather than volume.
Traditional debugging often involves a linear search through logs, which can take hours for complex, distributed systems. AI-driven debugging tools compress this timeline by correlating disparate data points—such as network latency, memory usage, and code snippets—to pinpoint the exact line of code responsible for the error. This automation transforms the developer's role from detective to validator, focusing human effort on solution design rather than data gathering.
The following comparison illustrates the difference between manual workflows and AI-assisted debugging in a production environment.
| Workflow Step | Manual Debugging | AI-Assisted Debugging |
|---|---|---|
| 1 | User reports bug via email or ticket | AI captures crash stack trace and device state |
| 2 | Developer reproduces the issue locally | AI correlates logs to identify root cause |
| 3 | Manual search through thousands of log lines | AI highlights the specific code block and variables |
| 4 | Fix applied after lengthy investigation | Fix suggested or auto-deployed via CI/CD pipeline |


As an Amazon Associate, we may earn from qualifying purchases.
Choosing the right AI debugging assistant
Selecting the best debugging tools requires matching the AI's capabilities to your specific stack and workflow. A tool that excels at Python refactoring may struggle with C++ memory management, making language coverage the first checkpoint.
Evaluate IDE integration before committing. The best assistant should feel like a natural extension of Visual Studio Code, IntelliJ, or your preferred editor, rather than a separate tab you must constantly switch to.
Consider your data privacy needs. If you are working with proprietary codebases, verify that the vendor does not train public models on your source code. A clear data retention policy is non-negotiable for enterprise-grade development.
- Language Support: Ensure the AI understands your primary languages and frameworks.
- IDE Integration: Check for seamless plugins in your current development environment.
- Data Privacy: Confirm that your code is not used for model training.
- Cost Structure: Compare per-seat licensing against free tiers for small teams.
Frequently asked questions about AI debugging tools
What are the debugging tools? Debugging tools are software utilities that help developers identify and resolve errors in code. Traditional options include command-line interfaces like GDB or LLDB, and IDE-integrated debuggers like PyCharm or Visual Studio. AI-powered debugging tools automate this process by analyzing codebases, detecting anomalies, and suggesting fixes, significantly reducing manual review time.
What is the best debugging tool? There is no single "best" tool, as it depends on your tech stack and workflow. For general-purpose AI assistance, tools like GitHub Copilot or Amazon CodeWhisperer offer broad language support. For deep runtime analysis, specialized tools like Dynatrace or Datadog provide comprehensive visibility into application performance and errors.
What is the best AI tool for debugging? The best AI tool depends on your specific needs. For integrated development environments, GitHub Copilot is widely used for its seamless integration. For static code analysis and security vulnerabilities, tools like Snyk or SonarQube leverage AI to detect issues early. For runtime performance debugging, AI-driven observability platforms like Datadog are industry standards.
Can ChatGPT debug my code? Yes, ChatGPT can help debug code by analyzing snippets, explaining errors, and suggesting fixes. However, it is not a replacement for a full debugging environment. It works best as a supplementary tool for quick checks or understanding complex logic, rather than for deep, real-time runtime debugging or security auditing.

No comments yet. Be the first to share your thoughts!