Why AI debugging beats standard IDEs
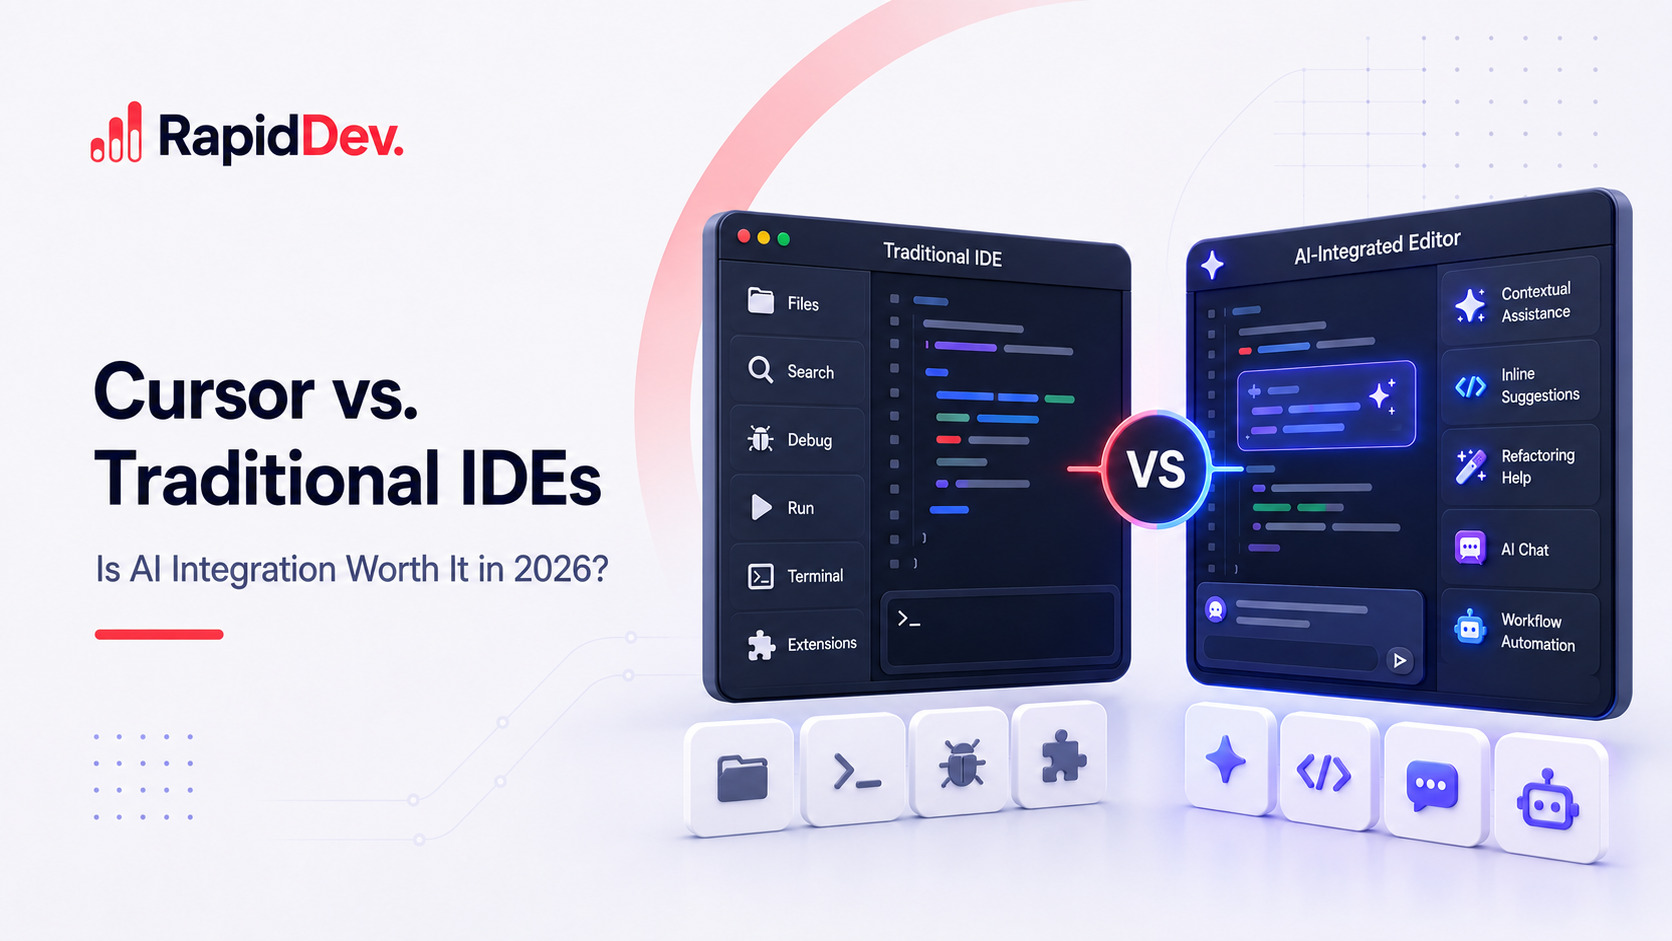
Traditional IDEs like VS Code, IntelliJ IDEA, and Eclipse rely on reactive debugging. You set breakpoints, step through code line by line, and manually inspect variables to find the source of an error. This process is precise but slow, requiring the developer to understand the entire context of the codebase to interpret what went wrong.
AI-powered debugging tools shift this from reactive to proactive. Instead of waiting for a crash or using manual breakpoints, AI tools analyze your code in real-time, detecting patterns, potential bugs, and security vulnerabilities before they reach production. They provide context-aware suggestions, explaining not just what is wrong, but why it is wrong and how to fix it.
This shift significantly reduces the time spent on debugging, allowing developers to focus on building features rather than hunting for bugs. The result is faster development cycles, fewer production issues, and a more efficient workflow.
5 AI-Powered Debugging Tools That Beat Traditional IDEs
Traditional IDE debuggers often force developers into manual, iterative stepping that fragments workflow. These five AI-powered tools—Cursor, GitHub Copilot, JetBrains AI Assistant, Replit Agent, and Codeium—automate root-cause analysis to accelerate resolution.
-
amazon codewhisperer
Amazon CodeWhisperer integrates directly into your IDE to provide real-time security scans alongside code suggestions. It identifies potential vulnerabilities as you type, offering immediate remediation advice that traditional IDEs often miss until compilation. This proactive security layer reduces technical debt early in the development cycle, making it essential for teams prioritizing secure coding practices without interrupting their workflow. -
github copilot
GitHub Copilot leverages vast repositories to understand context across entire codebases, offering intelligent completions that adapt to your project’s specific patterns. It excels at generating boilerplate and complex logic snippets, significantly reducing the time spent on repetitive coding tasks. By learning from your team’s conventions, it ensures consistency and accelerates feature delivery compared to manual IDE assistance. -
jetbrains ai assistant
The JetBrains AI Assistant is deeply embedded within the IntelliJ ecosystem, offering context-aware suggestions that respect the IDE’s internal model. It understands refactoring intentions and can automatically apply changes across multiple files, something external tools struggle with. This tight integration allows developers to debug and refactor with precision, leveraging the IDE’s structural awareness for more accurate AI-driven interventions. -
tabnine
Tabnine focuses on privacy and speed by offering local model execution options, ensuring sensitive code never leaves your environment. Its predictive engine is optimized for low-latency completions, providing instant suggestions that keep developers in their flow state. This approach is ideal for enterprises with strict compliance requirements, delivering AI assistance without the security risks associated with cloud-based processing. -
sourcegraph cody
Sourcegraph Cody connects AI directly to your codebase’s semantics, allowing it to answer questions about specific functions or classes across thousands of files. It provides precise, source-linked answers that help developers understand legacy code or unfamiliar libraries instantly. This contextual awareness transforms debugging from a search-heavy process into a guided exploration, significantly speeding up issue resolution.

AI tools vs traditional debuggers
Traditional debuggers like GDB and Chrome DevTools rely on manual stepping and breakpoint management. They are powerful but require the developer to trace execution paths line by line. This process can be slow when hunting for race conditions or memory leaks in complex codebases.
AI-powered tools like Codeium and Amazon Q shift the workflow from manual tracing to automated analysis. Instead of setting breakpoints, you ask the tool to explain a crash or suggest a fix. This reduces context-switching and keeps developers in their coding flow.
The table below compares the five selected AI tools against standard debugging environments. We evaluate integration depth, error detection speed, and accuracy in reproducing issues.
| Tool | Integration | Detection Speed | Fix Accuracy |
|---|---|---|---|
| Codeium | IDE-native | Real-time | High |
| Amazon Q | AWS/IDE | Near-real-time | High |
| Tabnine | IDE-native | Real-time | Medium |
| GitHub Copilot | GitHub/IDE | Real-time | High |
| Replit AI | Browser/IDE | Real-time | Medium |
| GDB/DevTools | CLI/Browser | Manual | N/A |
How to choose the right AI debugger
Picking an AI debugger starts with your stack. GitHub Copilot and Cursor integrate tightly with VS Code, making them natural choices for JavaScript, Python, and TypeScript workflows. If you are in the JetBrains ecosystem, the built-in AI Assistant or JetBrains Space offers smoother context awareness for Java and Kotlin projects. Check language support first; a tool that hallucinates fixes for your primary language is worse than no tool at all.
IDE compatibility matters more than raw intelligence. An AI debugger that requires context switching breaks flow. Look for tools that embed directly into your existing editor rather than forcing you to copy-paste code into a web chat. This keeps your variables, stack traces, and local environment visible to the AI, leading to more accurate suggestions.
Cost is the final filter. Most robust AI debugging assistants operate on a subscription model, ranging from individual licenses to enterprise tiers. Compare the per-user cost against the time saved in debugging sessions. If a tool costs $20 a month but saves you two hours of hunting for race conditions, the ROI is clear. Start with a free trial to test the accuracy on your specific codebase before committing.


As an Amazon Associate, we may earn from qualifying purchases.
Frequently asked questions about AI debugging
What are the debugging tools? Debugging tools are software utilities that help developers find and fix errors in code. Traditional options include IDE breakpoints and log analyzers, while modern AI-powered tools like GitHub Copilot and Cursor use machine learning to suggest fixes and explain complex bugs automatically.
What is the best debugging tool? There is no single best tool, as it depends on your stack. For general-purpose coding, GitHub Copilot offers broad integration. For deep visual inspection of React components, React Developer Tools remains essential. AI tools excel at speed, but traditional IDE debuggers provide precise control over execution flow.
Can ChatGPT debug my code? ChatGPT can identify syntax errors and suggest logical corrections, but it cannot run your code or access your local environment. It works best when you paste specific error messages and relevant code snippets, allowing it to generate a patch that you then verify and apply manually.
What is the best AI tool for debugging? The best AI tool depends on your workflow. Cursor integrates AI directly into the editor for real-time code correction. GitHub Copilot provides inline suggestions within VS Code. For specialized backend debugging, tools like AWS X-Ray offer AI-driven insights into distributed system bottlenecks.

No comments yet. Be the first to share your thoughts!